

Your state’s SAT average is useful context, not your goal. It tells you how test-takers near you performed, not what your target score should be.
Your target score should come from the colleges on your list and national percentiles.
In this guide, we’ll explain how to do that, using the most recent College Board reporting for the Class of 2025.
Now, here’s something that makes 2026 different: a growing list of selective colleges has reinstated standardized test requirements, including MIT, Harvard, Yale, Stanford, Brown, Dartmouth, Cornell, Caltech, and the University of Texas at Austin. Picture this — the test-optional wave that peaked after the pandemic is now receding at the top of the admissions food chain. The takeaway? Knowing where your SAT score stands, both nationally and against your target schools, matters more in 2026 than it has in years.
The SAT Format in 2026
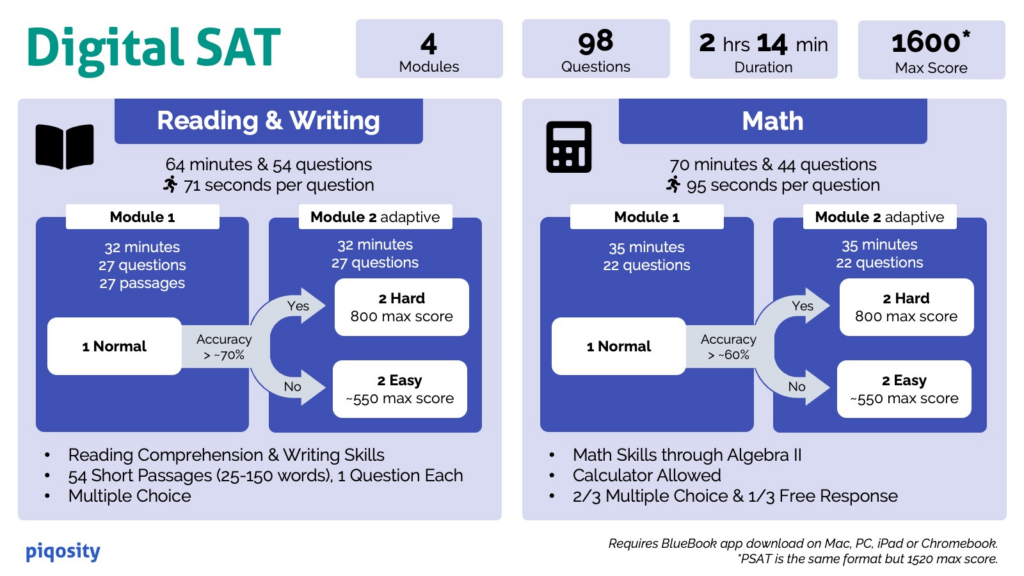
The SAT is now a digital exam with two sections. You take Reading and Writing first, then Math. Total testing time is 2 hours 14 minutes, with 64 minutes for Reading and Writing and 70 minutes for Math.
Scoring still works the same way. Each section is scored from 200 to 800, for a total score range of 400 to 1600. That means your plan should still focus on two levers: your Reading and Writing section score and your Math section score.
Here’s the deal on the digital format: the test is section-adaptive. Each section has two modules, and your performance on the first module determines the difficulty of the second. Want to know why that matters? Strong performance early unlocks a higher scoring ceiling, so your opening questions carry real weight. The test also includes built-in tools in the Bluebook app — a Desmos graphing calculator available throughout the Math section, a countdown timer, an answer-flagging tool, and an answer eliminator.
For test dates beginning August 23, 2025, the SAT registration fee is $68. If you qualify, you can use a fee waiver instead of paying the fee.
Fee waivers are built for students with financial need. It’s eligibility for low-income 11th and 12th-graders, including students who qualify for programs like the National School Lunch Program. If you think you qualify, ask your school counselor early so you can test without financial stress.
National Average SAT Score for the Class of 2025
For the Class of 2025, the College Board reports a mean total SAT score of 1029, with 521 in Reading and Writing and 508 in Math. The total number of SAT takers in this reporting group is 2,004,965.
Treat 1029 SAT score as a midpoint marker, not a finish line. Many colleges, especially more selective ones, expect scores well above the national average for admitted students who submit scores.
A national average SAT score can shift slightly year to year. Percentiles tell you where your score ranks against other test takers, which is usually what you need for goal-setting.
What a Good SAT Score Looks Like Using Percentiles
A good SAT score depends on your college list. Still, percentiles give you a fast reality check.
There are two percentile types: nationally representative percentiles and user group percentiles. User group percentiles compare you to actual SAT test takers from the last three graduating classes.
If you want a simple anchor, use these two points:
- A 1010 is about the 50th percentile for both nationally representative and user group percentiles.
- A 1300 is about the 86th user percentile. That typically puts you in a strong competitive range for many solid, four-year schools.
For the SAT, the benchmark scores are 480 in Reading and Writing and 530 in Math. Benchmarks are not admissions cutoffs, but they help you spot which section needs the most work.
Your best move is to connect percentiles to your college list. Pull the middle 50% SAT range for each school you like. If your score is below that range, your SAT becomes a lever you can still improve. If your score is inside or above that range, you can shift effort to other parts of your college application.
Average SAT Scores by State for the Class of 2025
In states where almost everyone tests, the average usually drops because the testing pool includes a wider range of students. In states where very few students test, the average usually rises because test takers are more self-selected.
Some states use the SAT as a statewide accountability assessment for 11th graders. Those states include Colorado, Delaware, Connecticut, Michigan, Indiana, New Hampshire, Rhode Island, New Mexico, and West Virginia. When you compare state averages, keep those policy differences in mind.
Use the table below as a reference point, then compare states with similar participation rates. That keeps your comparisons fair and more useful.
Average SAT Scores by State
Data reflect Class of 2025. State participation and average total scores come from a compiled Class of 2025 state summary, with District of Columbia confirmed from the official DC report.
| State | % Taking SAT | Avg Total Score |
| Alabama | 3% | 1172 |
| Alaska | 27% | 1097 |
| Arizona | 10% | 1194 |
| Arkansas | 2% | 1177 |
| California | 26% | 1096 |
| Colorado | 90% | 987 |
| Connecticut | 91% | 989 |
| Delaware | 94% | 933 |
| Florida | 87% | 970 |
| Georgia | 56% | 1038 |
| Hawaii | 29% | 1125 |
| Idaho | 69% | 1003 |
| Illinois | 99% | 961 |
| Indiana | 100% | 950 |
| Iowa | 2% | 1211 |
| Kansas | 2% | 1238 |
| Kentucky | 2% | 1181 |
| Louisiana | 2% | 1195 |
| Maine | 39% | 1078 |
| Maryland | 73% | 1003 |
| Massachusetts | 57% | 1114 |
| Michigan | 100% | 953 |
| Minnesota | 3% | 1210 |
| Mississippi | 1% | 1223 |
| Missouri | 4% | 1174 |
| Montana | 5% | 1205 |
| Nebraska | 1% | 1249 |
| Nevada | 7% | 1177 |
| New Hampshire | 76% | 1017 |
| New Jersey | 66% | 1061 |
| New Mexico | 100% | 875 |
| New York | 62% | 1045 |
| North Carolina | 22% | 1165 |
| North Dakota | 1% | 1254 |
| Ohio | 20% | 1018 |
| Oklahoma | 2% | 1150 |
| Oregon | 24% | 1127 |
| Pennsylvania | 47% | 1084 |
| Rhode Island | 99% | 935 |
| South Carolina | 53% | 1017 |
| South Dakota | 2% | 1214 |
| Tennessee | 4% | 1189 |
| Texas | 74% | 964 |
| Utah | 2% | 1229 |
| Vermont | 49% | 1115 |
| Virginia | 48% | 1112 |
| Washington | 35% | 1095 |
| West Virginia | 93% | 911 |
| Wisconsin | 2% | 1240 |
| Wyoming | 1% | 1234 |
| District of Columbia | 85% | 958 |
You can turn this table into a real plan in three steps. Keep it simple and action-focused, since your goal is a stronger application, not trivia.
- Find your state’s participation rate first. If participation is high, the state average is a broad-population average. If participation is low, the average reflects a more self-selected testing group.
- Compare your score to national percentiles, not your state. A 1010 is around the 50th percentile, and a 1300 is around the 86th user percentile. That tells you how your score travels across state lines.
- Set a target using your colleges’ middle 50 percent ranges. Your goal should usually land near the middle or upper end of that band. If you are below it, plan a retake with a section-by-section focus.
Highest Average SAT Scores
If only one to two percent of graduates take the SAT, the average usually rises. That does not mean the average student in that state scores higher. It usually means the testing group is smaller and more academically focused.
Here are four high-average states with very low participation in the Class of 2025 reports:
- North Dakota: 1254 average, 1% participation.
- Nebraska: 1249 average, 1% participation.
- Wisconsin: 1240 average, 2% participation.
- Wyoming: 1234 average, 1% participation.
Treat these as examples of the “low participation effect.” If your state looks like this, compare yourself more to national percentiles and your target colleges, not your state average.
Lower Averages SAT Scores
When a state tests most graduates, the SAT average usually drops. That is not a failure. It is a wider testing pool.
These four states show the pattern clearly in the Class of 2025 reports:
- New Mexico: 875 average, 100% participation.
- West Virginia: 911 average, 93% participation.
- Delaware: 933 average, 94% participation.
- Rhode Island: 935 average, 99% participation.
You will also see other high-participation states sitting below the national average. Indiana reports 100% participation with a 950 mean score, and Michigan reports 100% participation with a 953 mean score.
If your state requires broad testing, ignore the “rank.” Focus on your own score trajectory and your college list targets.
Participation Rates Explained
If you only remember one thing, remember this list. Participation changes what the average means.
States with high participation rates:
- New Mexico: 100%.
- Indiana: 100%.
- Michigan: 100%.
- Rhode Island: 99%.
States with low participation rates:
- North Dakota: 1%.
- Nebraska: 1%.
- Mississippi: 1%.
- Wyoming: 1%.
Use this as your context filter before you compare your state to another state.
Why SAT Scores Differ in Each State
State score differences usually come down to two mechanics.
1. Some states use the SAT as an accountability assessment for 11th graders. States in that category are Colorado, Delaware, Connecticut, Michigan, Indiana, New Hampshire, Rhode Island, New Mexico, and West Virginia. This tends to raise participation and lower the average, because more students test.
2. Opt-in behavior matters when the SAT is optional. When fewer students test, the group often skews toward college-bound students aiming for selective admissions or scholarships.
This school-day shift is also national. College Board reports that 68% of SAT takers in the Class of 2025 tested during the school day, and 97% took a digital SAT. That pattern pushes participation up, which can pull averages down in school-day states.
How to Use Your State Average Without Misreading It
Now, here’s something most students get wrong: they see their state’s average and either panic or relax — when neither reaction makes sense. Want to know how to read your state average correctly? It comes down to context.
For starters, here are the most common mistakes students make with state averages:
- Treating the state average as a target. Your state average reflects who tested in your state, not what your colleges want. A 1100 might be well above your state average but still below your dream school’s middle 50%. Always anchor to your college list, not your state.
- Comparing across very different participation rates. Comparing your 1% participation state to a 100% participation state is apples-to-oranges. A 1230 in a low-participation state and a 950 in a 100%-participation state can reflect similar underlying student populations once you account for who’s actually testing.
- Ignoring the school-day effect. If your state administers the SAT to all 11th graders during the school day, your state average includes students who weren’t necessarily college-bound. That naturally pulls the average down — it says nothing about your individual competitiveness.
- Forgetting that colleges see your context. Admissions officers know your state’s testing policy. They read your score against your school and region, not against a national leaderboard. A strong score in a high-participation state still stands out.
The takeaway? Use your state average as background information, then move immediately to the two numbers that actually drive decisions: your national percentile and your target colleges’ middle-50% ranges. Those tell you whether to retake, where to focus, and how to build a balanced school list.
How Many Times Should You Take the SAT?
Here’s the kicker most students don’t hear early enough: the SAT is not a one-shot test. Most students improve when they take it more than once, and colleges overwhelmingly accept your best scores. Want to know the smart approach?
Here’s the deal on retaking the SAT in 2026:
- Plan for two to three sittings. A common pattern is one diagnostic-style attempt in the spring of junior year, a focused retake in the early fall of senior year, and an optional third attempt if you’re close to a target threshold.
- Superscoring works in your favor. Many colleges superscore the SAT, meaning they combine your highest Reading and Writing score and your highest Math score across all your test dates. This rewards taking the test more than once and focusing each prep cycle on a single section.
- Score Choice gives you control. The College Board’s Score Choice policy lets you choose which test dates to send to most colleges — though always confirm each school’s policy, since a few require all scores.
- Diminishing returns are real. After three attempts, score gains typically flatten. If you’ve plateaued, redirect that energy into grades, rigor, essays, and activities, which often move your application more at that point.
- Watch the deadlines. Build your testing calendar backward from your application deadlines. Leave room for scores to be released (digital SAT scores arrive in about two weeks) and for one more attempt if needed.
The bottom line? Treat the SAT as a process, not a single high-stakes day. A planned sequence of two to three attempts, each with a clear section focus, is how most students reach their best score without burning out.
A One-Week SAT Plan That Builds Momentum
You do not need a perfect three-month plan to improve. You need a short cycle with clear deliverables. This plan assumes you can study about 60 to 90 minutes most days, with one longer session.
| Day | Deliverable | What You Do |
| Day 1 | Baseline score | Take an official full-length practice test in Bluebook. Review the score report once. |
| Day 2 | Error log | Build an error log with columns: skill, why missed, fix, and next drill. Pull 20 similar questions. |
| Day 3 | Reading and Writing reset | Drill one weak domain for 30 minutes, then redo missed questions. Use the Student Question Bank filters by skill. |
| Day 4 | Math reset | Drill one weak math domain for 30 minutes, then redo missed questions. Save patterns, not formulas. |
| Day 5 | Timing practice | Do two timed modules, one per section. Focus on pacing and skips. |
| Day 6 | Mixed set and review | Do a mixed set of 40 questions. Then update your error log. |
| Day 7 | Retest and decide | Take a second full-length Bluebook practice test. Set your next two-week goal. |
Your goal at the end of the week is not to be done. Your goal is a clear diagnosis and a repeatable routine. If your score rises, keep the cycle. If it stays flat, shrink your focus to two skills per section.
Helpful SAT Prep Resources
Start with official materials. They match the digital SAT format and the adaptive feel.
Bluebook is the core resource for full-length digital practice tests, plus a test preview so you can learn the interface before test day. The Student Question Bank is also useful for targeted drills because you can filter questions by skill and difficulty.
If you want structure, use a library prep book or a tutor to support the routine above. Libraries work well when you need volume and accountability. A tutor works best when you have a clear weakness and need fast correction.
SAT vs ACT: Quick Decision Check
Most colleges accept both tests, so your best choice is the one you can score higher on. If you already have a baseline SAT score, take one ACT practice test before you switch.
The ACT costs$68 for testing through July 2026, with a $25 writing add-on and a $4 science add-on option. If you prefer a longer test day with more rapid pacing, the ACT can fit you. If you prefer a digital format with fewer questions and more time per question, the SAT often feels more manageable.
Want to know what changed on the ACT recently? As of the 2025 Enhanced ACT, the test is shorter (about 2 hours for the core), the Science section is now optional and scored separately (not part of the Composite), and Math questions now have four answer choices instead of five. Unlike the digital SAT, the ACT is not adaptive — it stays linear whether you take it on paper or screen.
If you are on the fence, decide by evidence. Take one official SAT practice test for each exam and compare section-level comfort, not just the composite score.
How Empowerly Helps You Turn SAT Scores Into a Real Plan
State averages give context, but your admissions strategy needs specifics.
Empowerly counselors help you set a score target tied to your school list, build a test plan that fits your schedule, and decide when a retake helps.
Empowerly can also help you balance testing with grades, course rigor, and essays, so your application stays strong across the board.
Our comprehensive college counseling services offer actionable insights for every step of the college application process and have a 98% success rate.
From building your school list to making key admissions decisions, Empowerly is your trusted college admissions partner.
Book your FREE Empowerly consultation today.
Frequently Asked Questions
Here are the questions students ask most after seeing average sat scores by state.
What is the average SAT score in 2025?
The College Board reports a national mean total score of 1029 for the Class of 2025. Use that as a baseline, then set your real target from your colleges.
What is a good SAT score for top colleges?
A “good” score is one that lands in the middle 50% range of admitted students. If your score is below that band, plan a retake with a section focus. If your score is above the band, shift time to grades, rigor, and essays.
Which states have the highest SAT scores?
High averages often come from low participation states. North Dakota (1254) and Nebraska (1249) are examples, both at 1% participation.
Why is my state’s average low?
High participation lowers averages because more students test. New Mexico reports 100% participation with an 875 mean score, which reflects a broad testing pool.
Does participation rate change how I should read this table?
Yes. In low participation states, the average reflects a self-selected group. In high participation states, the average reflects most graduates. Compare states with similar participation before you draw conclusions.
Should I take the SAT again if I am near 1000?
If your target schools list a higher middle 50% range, a retake can help. If you are near 1000, the fastest gains often come from one section, not both. Use one full-length practice test to pick the section with the clearest path upward.
Is the SAT required again in 2026?
It depends on the school. A growing number of selective colleges — including MIT, Harvard, Yale, Stanford, Brown, Dartmouth, Cornell, Caltech, and UT Austin — have reinstated test requirements. Many other colleges remain test-optional. Always check each school’s current policy before deciding whether to submit.
Additional Resources
Need practical advice for navigating the college application process? Check out our guide, College Application Help: 15 Tips to Help You Succeed
Struggling to come up with a compelling essay? Explore our list of Top 40 College Essay Ideas and Topics to find inspiration for your application.
Looking for expert guidance on your college journey? Read our 10 Tips for Finding an Independent College Counselor to ensure you get the best support.
