Most often, those interested in college admissions focus on acceptance rates and how they are dwindling over time. That is a great basic entry point; but what does that tell us about the future? Let’s look beyond simple numbers to examine a different statistic that reveals much more about how colleges think. For one, yield can give us a statistical insight into how colleges determine their early classes; their regular acceptance pools; and even their overall admit pool sizes. That information is valuable; so here, we will discuss yield rate and admissions trends for top schools in the US.
Admissions has become more data-driven. The top universities—”like Harvard, Yale, Princeton, Stanford, Cornell, Columbia, Dartmouth, UPenn—”use statistics to shape their classrooms in productive ways.
Often, yield statistics can give us insight into the competitiveness of a school over time and relative to other schools. Yield is an important statistics across all types of schools. Because of this, universities are always aiming to increase this figure to appear more desirable.
What is yield, or yield rate?
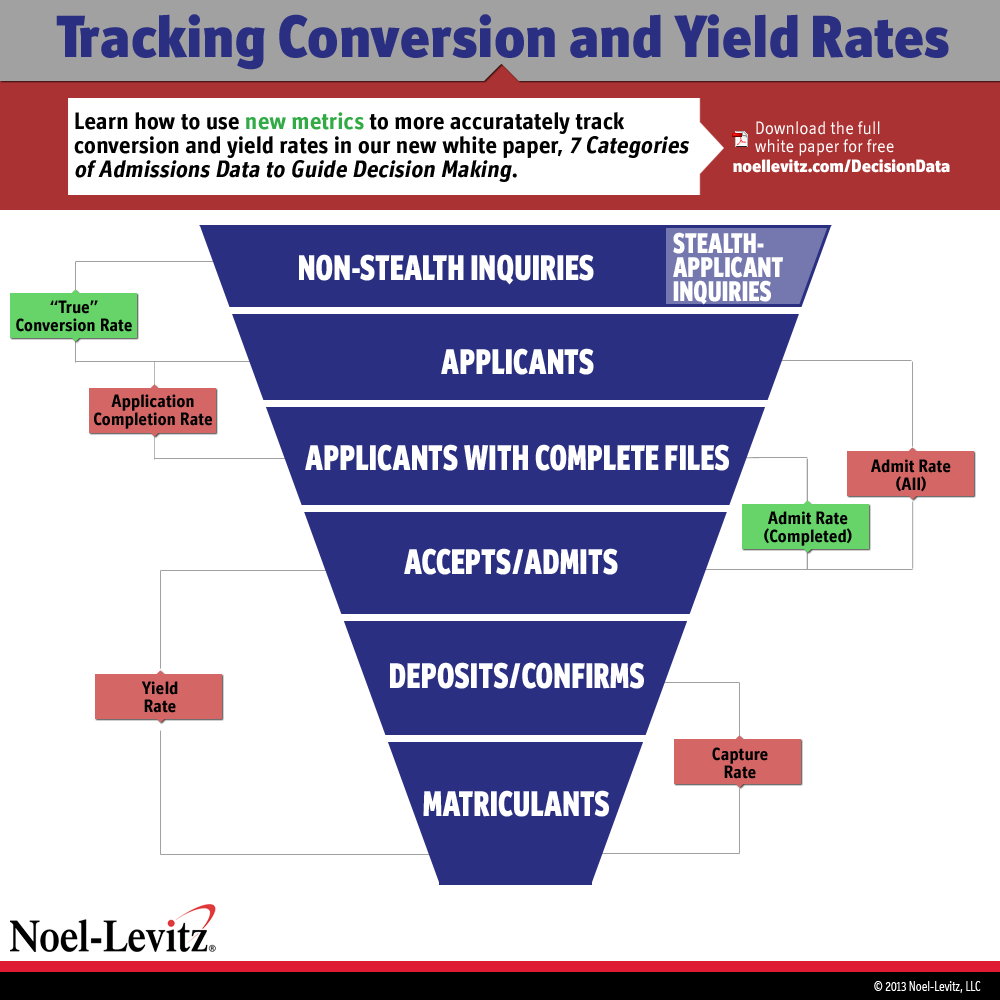
Yield is the percentage of students who accept an offer of admission at a particular school.
For colleges, this is important because it is a sign of “prestige” and relative competitiveness. Tracking this over time can give us insight into how the different schools think.

We will analyze yield trends at the Ivy League colleges in this article to show you the power of the yield analysis in determining early action, early decision, and regular decision college lists.
Early action decision strategy at Ivy Leagues
Acceptance rates at the Ivy League schools are roughly in line with each other on a trailing 5 year average basis, but yields vary widely. This tells us about underlying student preferences if they are admitted to different colleges, and can help us understand where we should apply to maximize our chances early.
The first metric to look at is the first mover ratio – the benefit we receive from applying Early Action or Early Decision versus Regular Decision. This can give us an overall sense of the increase in chances. Often if we are not an athlete or legacy (direct parent), we handicap this ratio by 0.5x to be more realistic.
Now, let’s compare the yields across the Ivy League. We find that Harvard is by far the highest yielder – meaning that students who get in accept their offer 80% of the time. The interesting point to note is that the 5 year average acceptance rate is in line with other schools. In total, this tells us that it may be wiser to apply to another equivalent college and prove our ambition to go there as there are fewer students who actually end up attending on a yield-basis. A stronger “Why Us” essay at Princeton or Yale can carry more weight in admissions.
Application volume and acceptance rate correlation
Correlation between application volume and acceptance rate can also give us great insights into how the admissions committee is affected by changes in the volume of applications each year. This in turn can tell us where to apply regular or early to maximize our chances of admissions. Taking a five year view on both regular decision acceptance rates and application volumes, we will focus on the Ivies for our analysis here.
Princeton
Princeton showed a Regular Decision correlation of 38%, meaning that higher application volumes means generally higher acceptance rates, but not linearly. It is harder to get into Harvard each year, although Harvard is open to developing more space for students each year and accepting more students. This is a good sign for long-term Regular Decision applicants.
Harvard
Harvard showed a similar trend, although it is less flexible than Harvard in accepting more applicants with increases in applicant pool sizes. The correlation is 30% vs. Harvard’s 38%. Still, it is one of the most flexible programs with Princeton in the Regular Decision pool we analyzed here.
Yale
Yale showed a -10% correlation between Regular Decision acceptance rates and application volumes, suggesting that it will become significantly more difficult to apply Regular here if application volumes continue increasing at the same rate and the admissions committee continues in the same fashion. This is probably a factor of space, availability on campus of new housing, and the admissions committee’s conscious decision to limit class size over the years, especially when application volumes increase.
Final note
If you have individual specific questions about yield rate and admissions trends, feel free to reach out to us. We are passionate about helping students access education and begin their best future.
