Harvard University has long stood on a pedestal as one of the nation’s oldest and most revered colleges. It has become exponentially difficult to get accepted at the undergraduate level, which contributes to the aura around the school. Over the past month, we have conducted detailed analysis on the school to understand statistical trends over time. These trends help us predict the future or at least guide students and parents in the college admissions process. In this article, we will turn our admissions focus on Harvard University as an example of how statistical analysis works.

Application Requirements
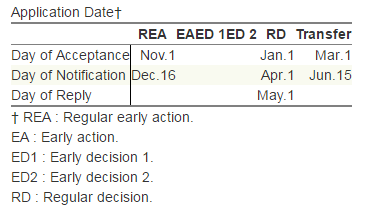
First we will start with the basics. It costs $75 to apply to Harvard and there are two rounds: restricted early action and regular decision. Restricted early action means you can apply early and get accepted early without any obligation to attend. But it also means you cannot apply to other early programs. Regular decision is the same but due later. Transfer applications are for students at 2-year colleges or other 4-year institutions looking to go to Harvard.
Below is a table for reference:
Acceptance Rate and Yield
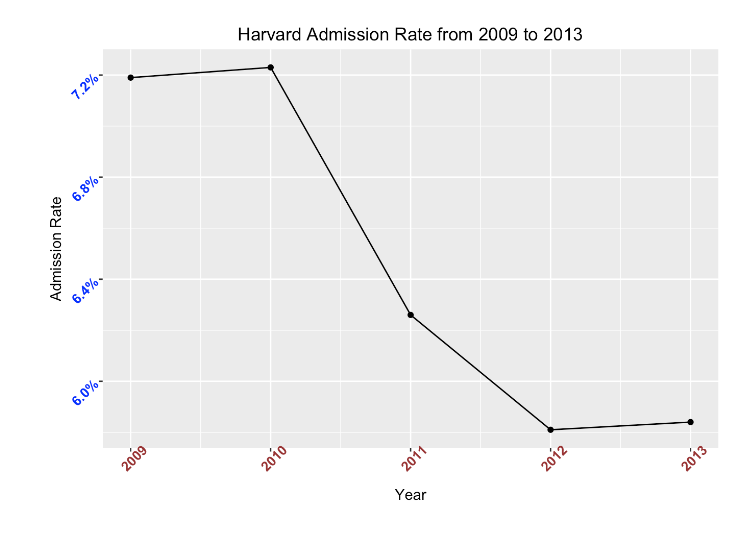
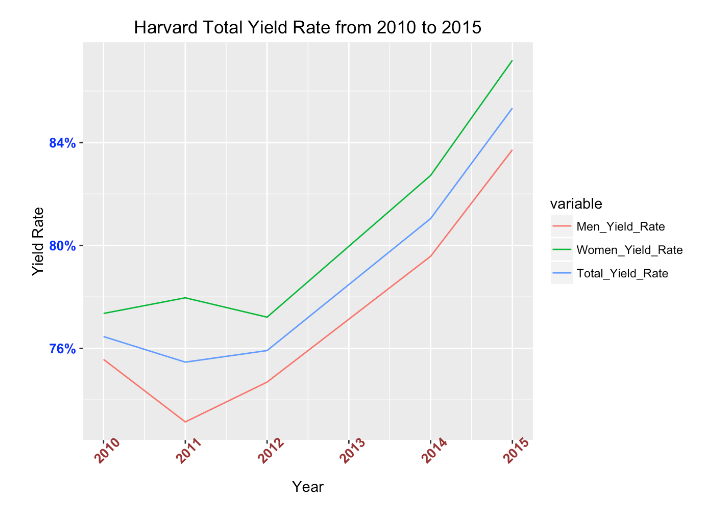
The acceptance rate at Harvard has gone down exponentially in the past 5 years. Due to the reintroduction of the restricted early action program in 2011, we see that Harvard has dipped below 6.0%. Conversely, the yield has increased significantly at the same time. Yield is the ratio of offers of admission to those that accept the offer. This trend is precisely what universities want – more applications and a better matching system where the university selects students who are 80% likely to accept the offer.
Student Life
Harvard is actually reducing class size on average over time. The graph below shows that classes, on average across the university, have about 6.5 students. This is down from around 7.0 students in 2010. This might not seem like a big drop; but when you consider the percentage drop of nearly 10% in 5 years, it looks like a concerted effort from Harvard. Looking at trends like this across universities can yield insights for students looking for smaller class environments. When turning our admissions data focus on Harvard, we find that it is definitely among that cohort.
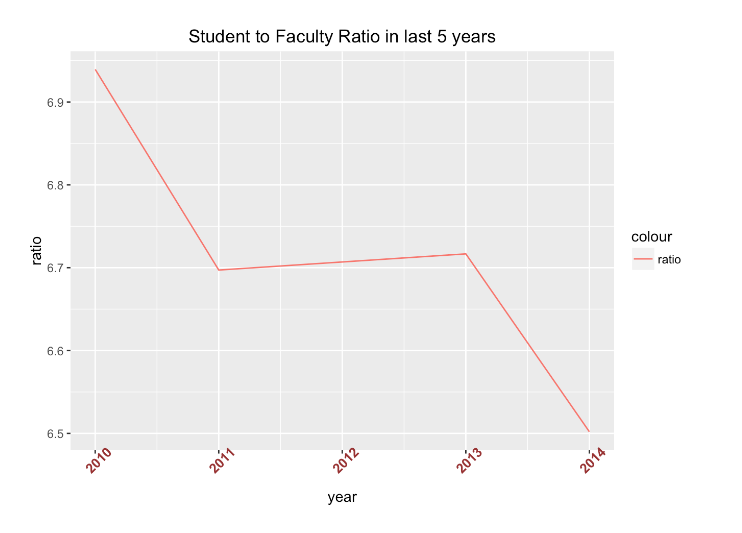
There are obvious exceptions like introductory science and math courses, and there are also probably outliers like higher-level liberal arts classes with 1 or 2 students. The average, however, is telling.
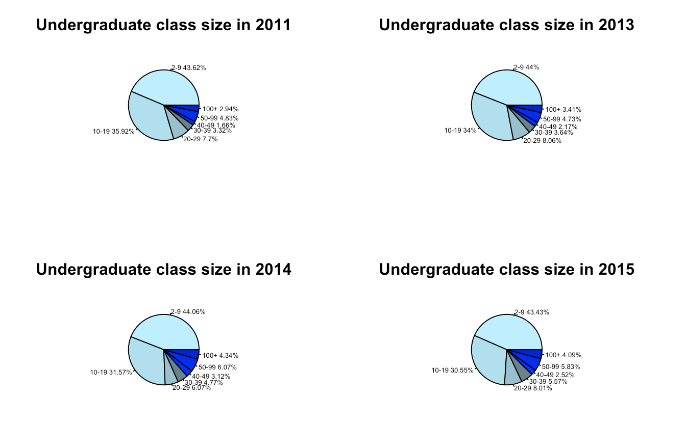
We are also including a quick distribution of the class size in a histogram-like analysis. From these pie graphs, we can actually see that class distribution is really focused in the less than 19 students per class sections.
Demographics
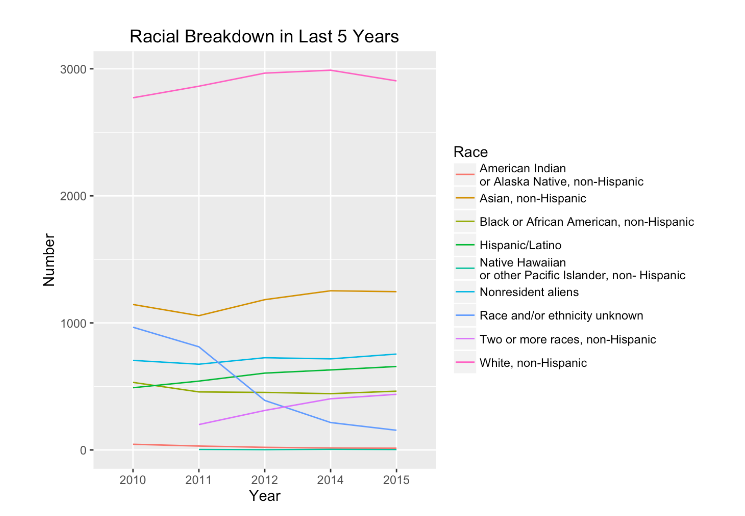
Harvard is becoming slightly more diverse over time. We can see that the number of students who do not declare a race has significantly decreased over time, and the number of Asian students has risen, but not dramatically. It seems like the number of international students has also risen over time, as well as Hispanic/Latino.
Financial Aid
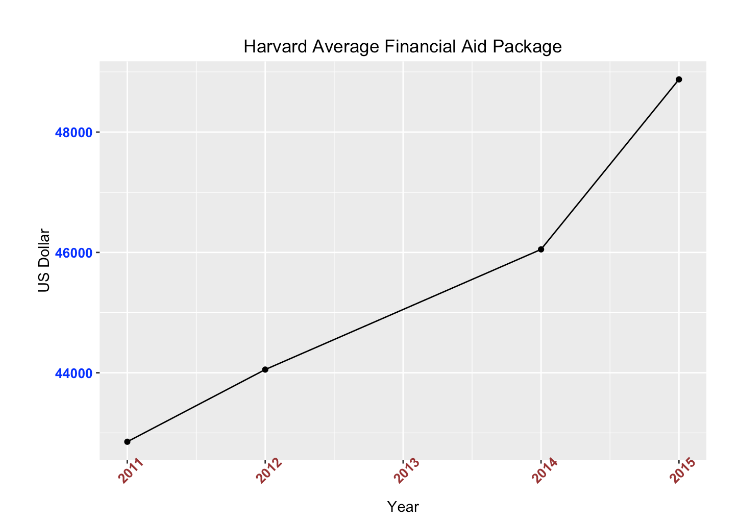
The big takeaways from financial aid for Harvard are that the average package is increasing of need-based aid, but the number of students who receive merit-based scholarship has dramatically reduced since the 1990’s. Harvard, in an effort to match similar universities like Stanford, is covering 100% of need-based aid, but need is subjective. Stanford recently defined it as $100,000 income per year.
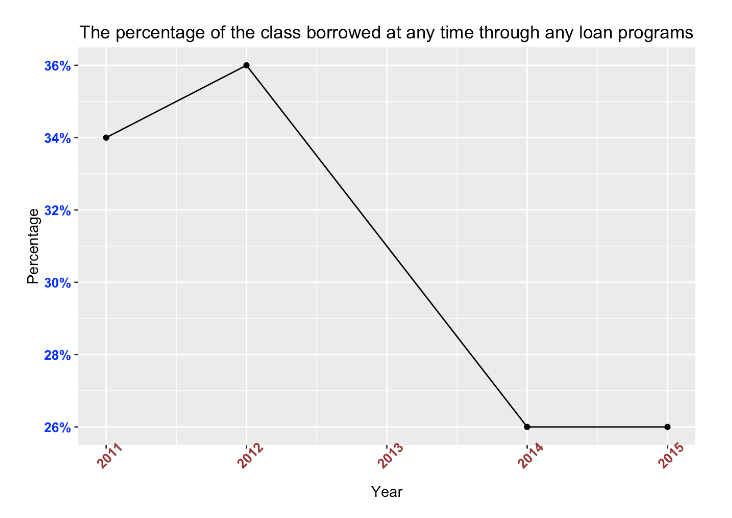
This second graph shows a telling trend – the number of students borrowing has dramatically decreased by 10% since 2012. This means that students in the middle – those that are not fully covered by need-based aid and those that cannot pay over $250,000 for a college education, are getting squeeze. The rise in international applications, who normally pay full fees, also helps to explain this trend.
To Review:
In this article, we review many of the key features of Harvard University in this statistical analysis. We turn our admissions focus on Harvard application data, acceptance data, student life, demographics, and financial aid. This is the very first part of our analysis on college admissions and we look forward to diving deeper into this data by looking at derivative statistics and ratios that we are inventing like the Squeeze Ratio – the ratio of applicants who applied/applications that enrolled.
For more information about this statistical analysis or to learn more, book your free consult here.
