

College Admissions Data
Many students and parents are interested in the classroom experience beyond the name of a brand-name university. Changes in degrees issued also gives some insight into how universities are thinking about class growth over time and degree completion. In addition, financial aid is an area with a lot of change at these top universities. By using data and historical analysis, we can parse together trends at several schools which can hint towards the future. College admissions data gives students and families more tools to empower their future.
We can start with Harvard University as an example school in this post to examine college admissions data. By using a variety of OIR, CDS, and other datasets, we have developed a series of charts to get to some conclusions.
Class Size
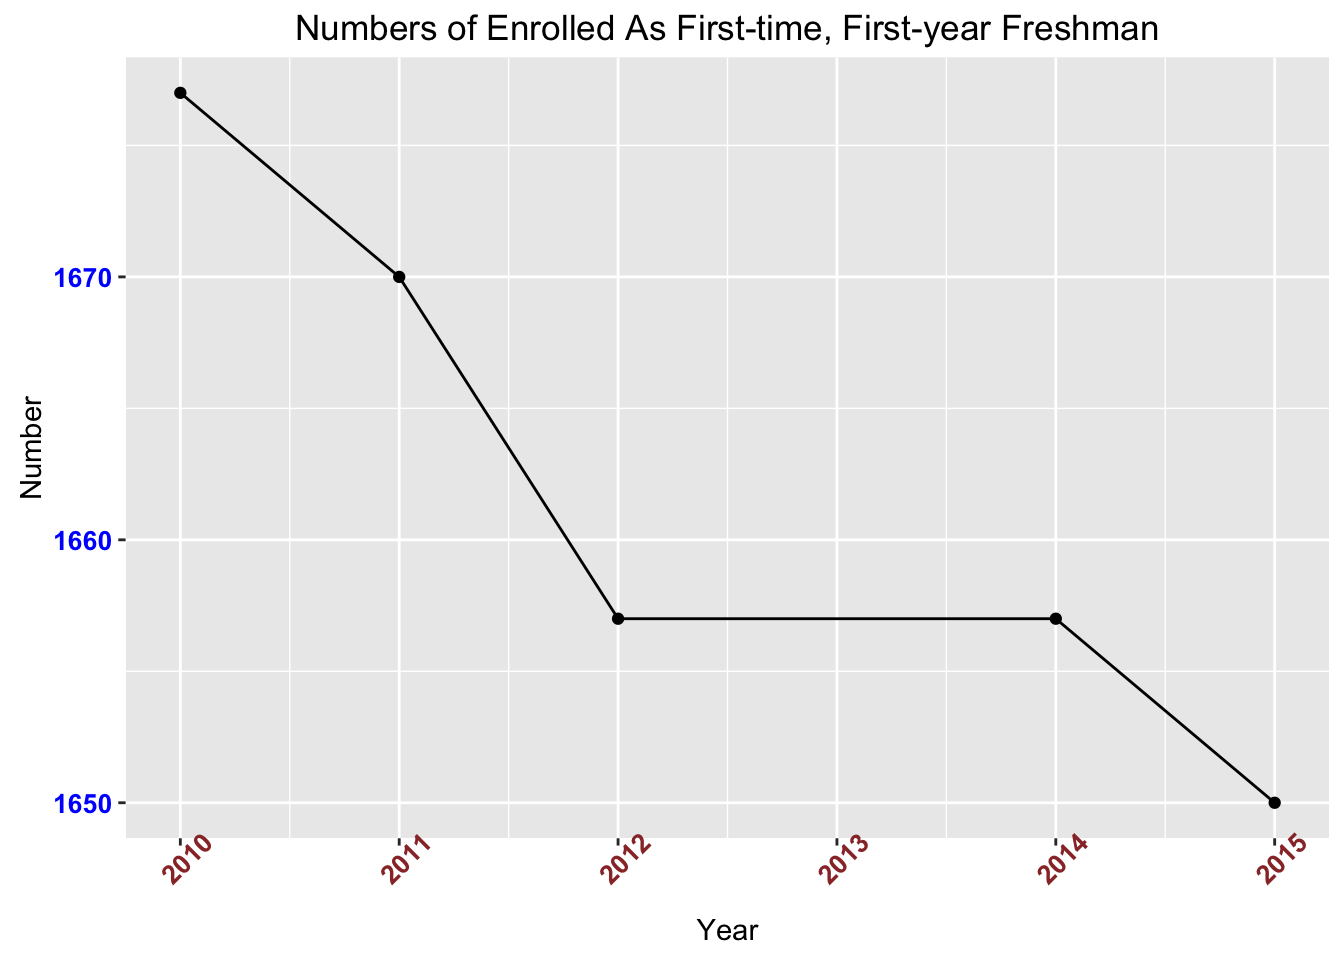
Harvard’s class size has actually been slightly shrinking in the past five years. So in addition to a plummeting acceptance rate, the actual size of the freshman class has shrunk about 2%. We believe this is negligible but it does prove one thing. Harvard is very focused on the classroom experience and is not looking to stuff their classrooms for the sake of tuition.
The other aspect of class size is the distribution of classes across the university. Are most classes 1-9 students or something more? At Harvard, it appears as if there has been a trend toward larger class, particularly in the 20-29 student range. Still, the vast majority of classes (~40%) are 1-9 students.
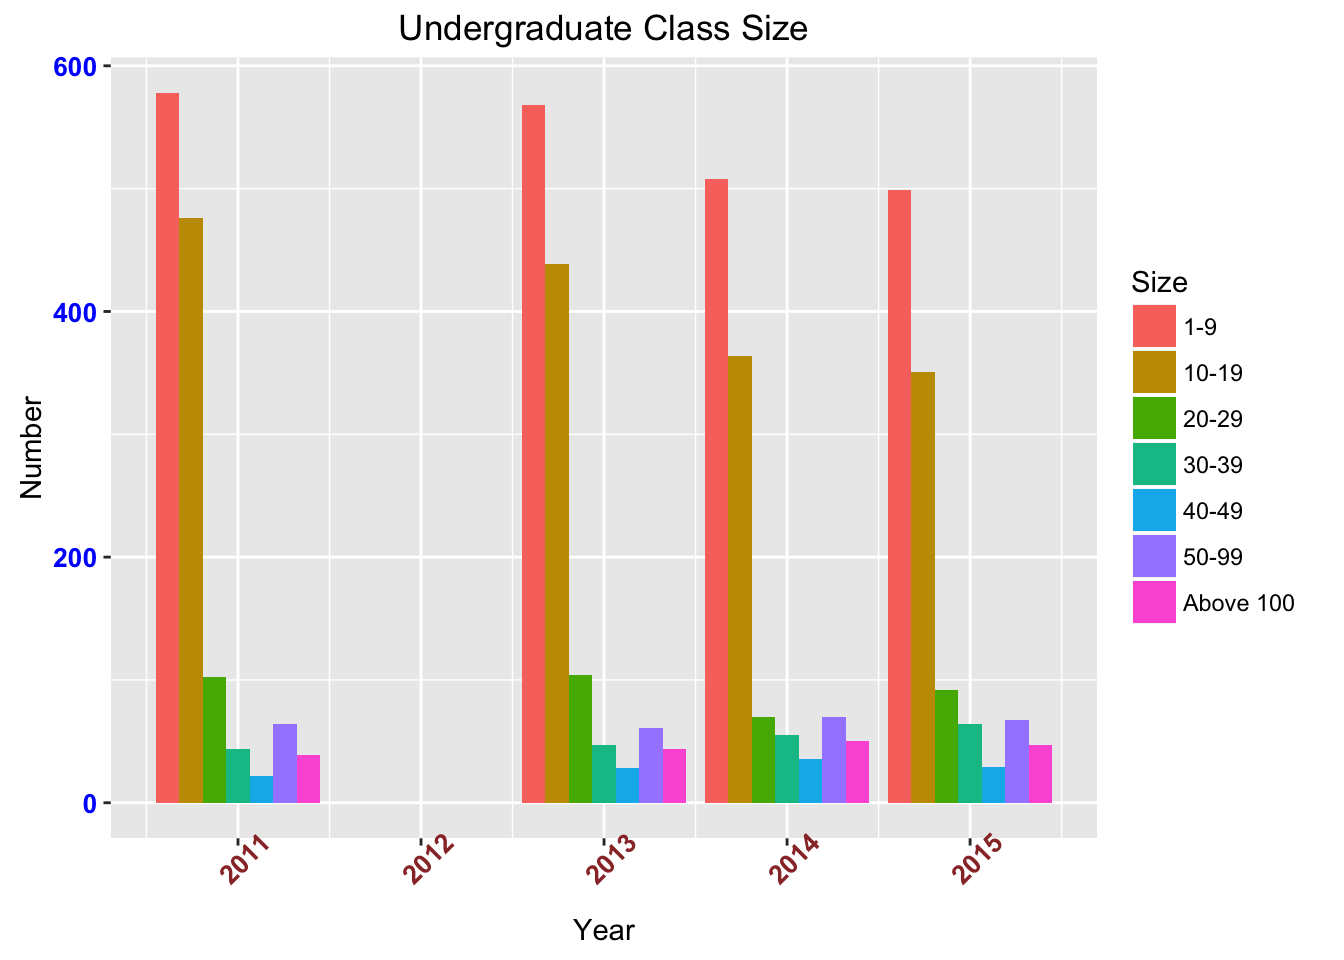
Combining this insight with the above, it looks like Harvard’s overall class size is getting smaller but their average class size is getting bigger. So Harvard is creating a tighter community with larger classes.
Taking into account the different types of majors can give us a hint into which classes are smaller at Harvard.
Degrees Conferred
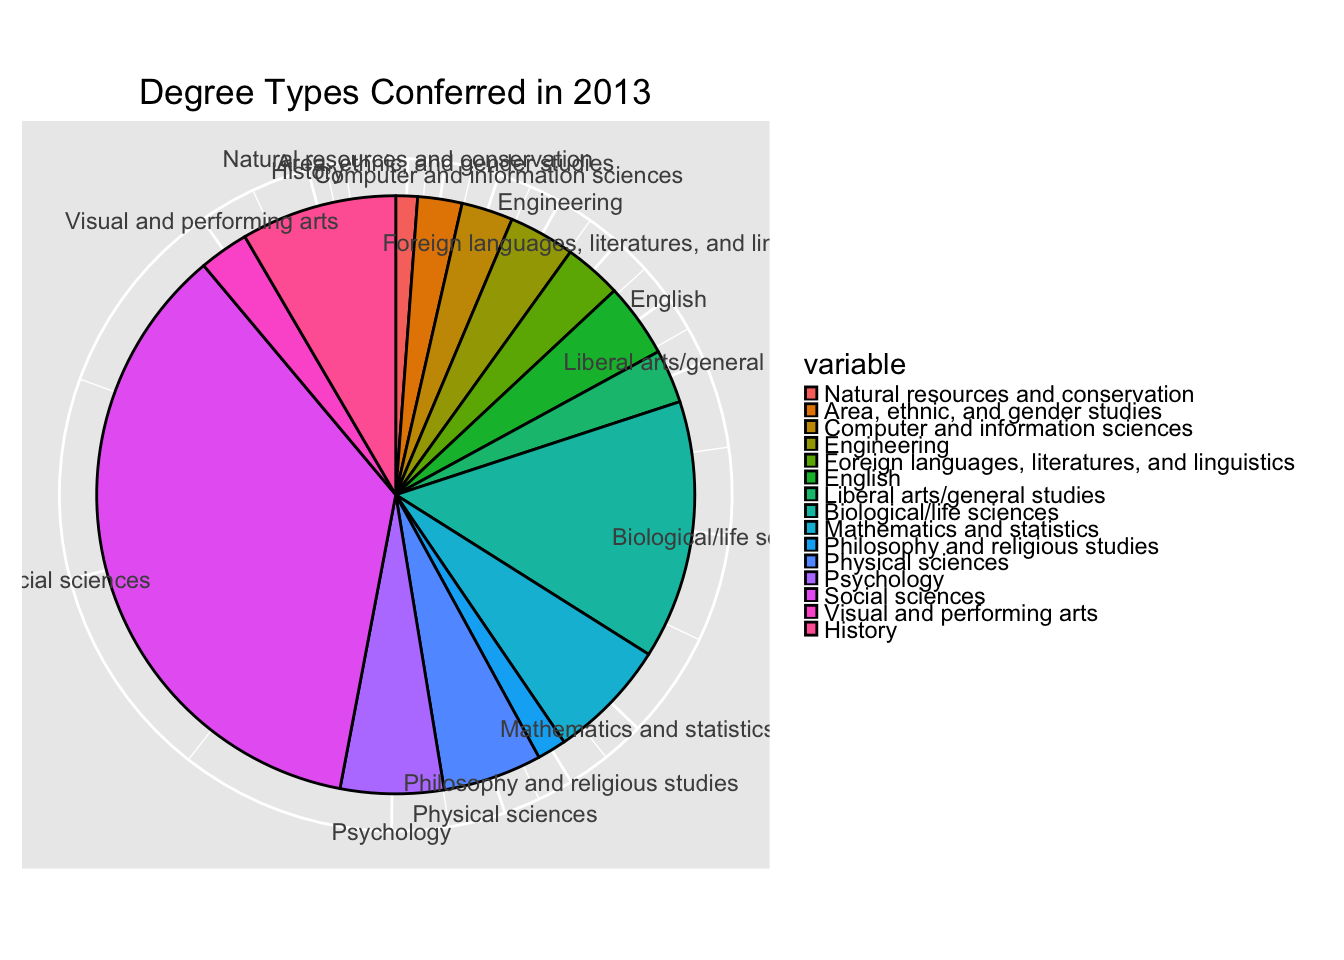
The majority of majors in 2013 at Harvard were in the social sciences field. This means that the smaller classes are likely to be in the social sciences, although there is not a strict correlation. Biology is a significant part of degrees conferred (likely pre-medical students).
Financial Aid
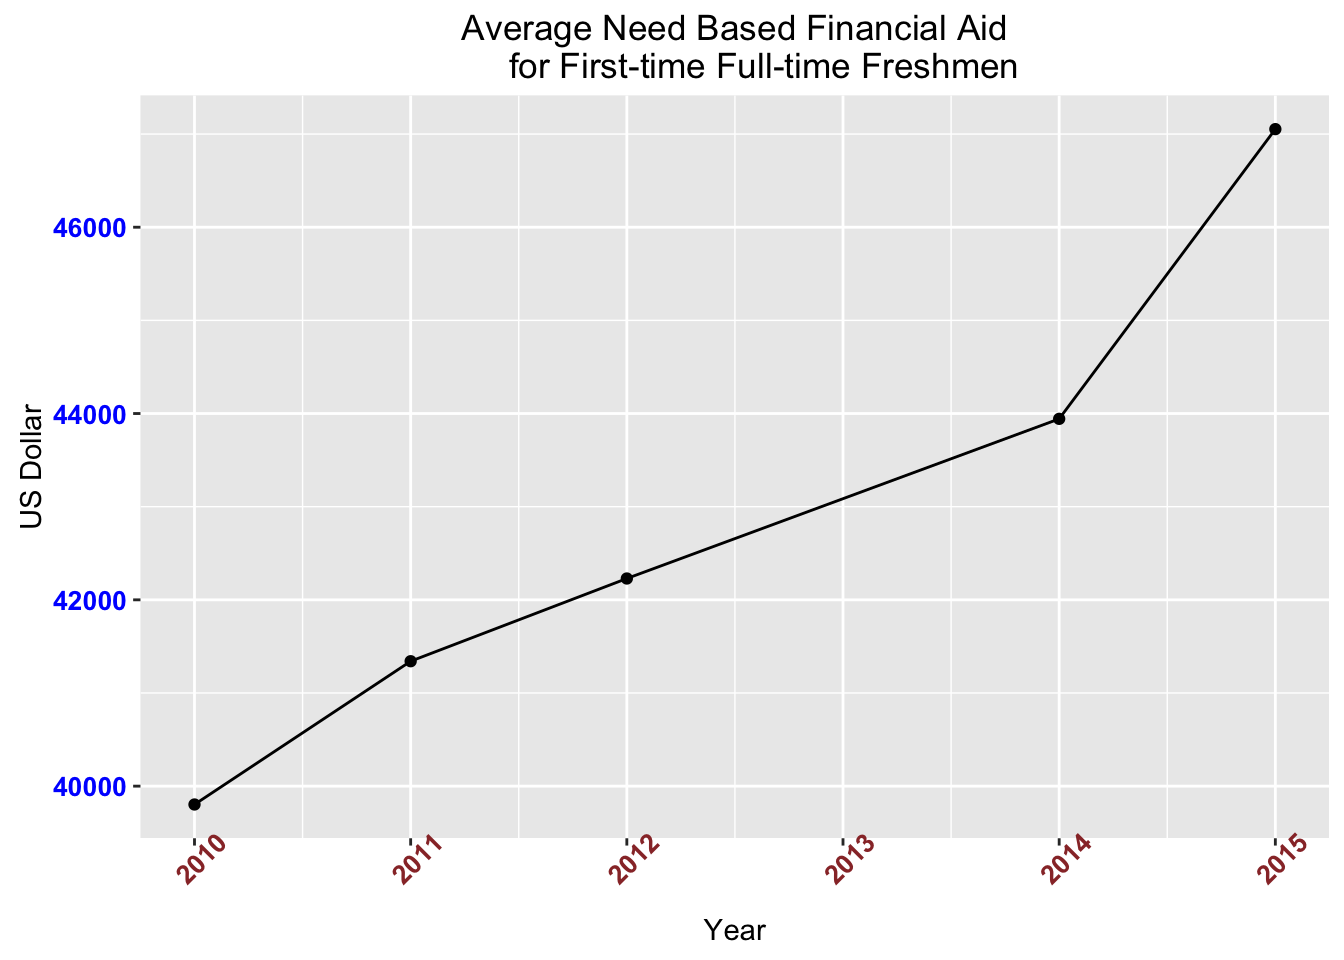
The final piece of analysis in this article will be around financial aid at Harvard. As Harvard and Stanford compete on need-based financial aid, it looks like the average need-based aid has actually increased 15% in the past 5 years. That is a significant jump, but qualification for aid varies at each school and in each parent’s situation. Stanford has publicly announced that they are covering tuition for families with incomes below $125,000, meaning that Harvard is likely similar.
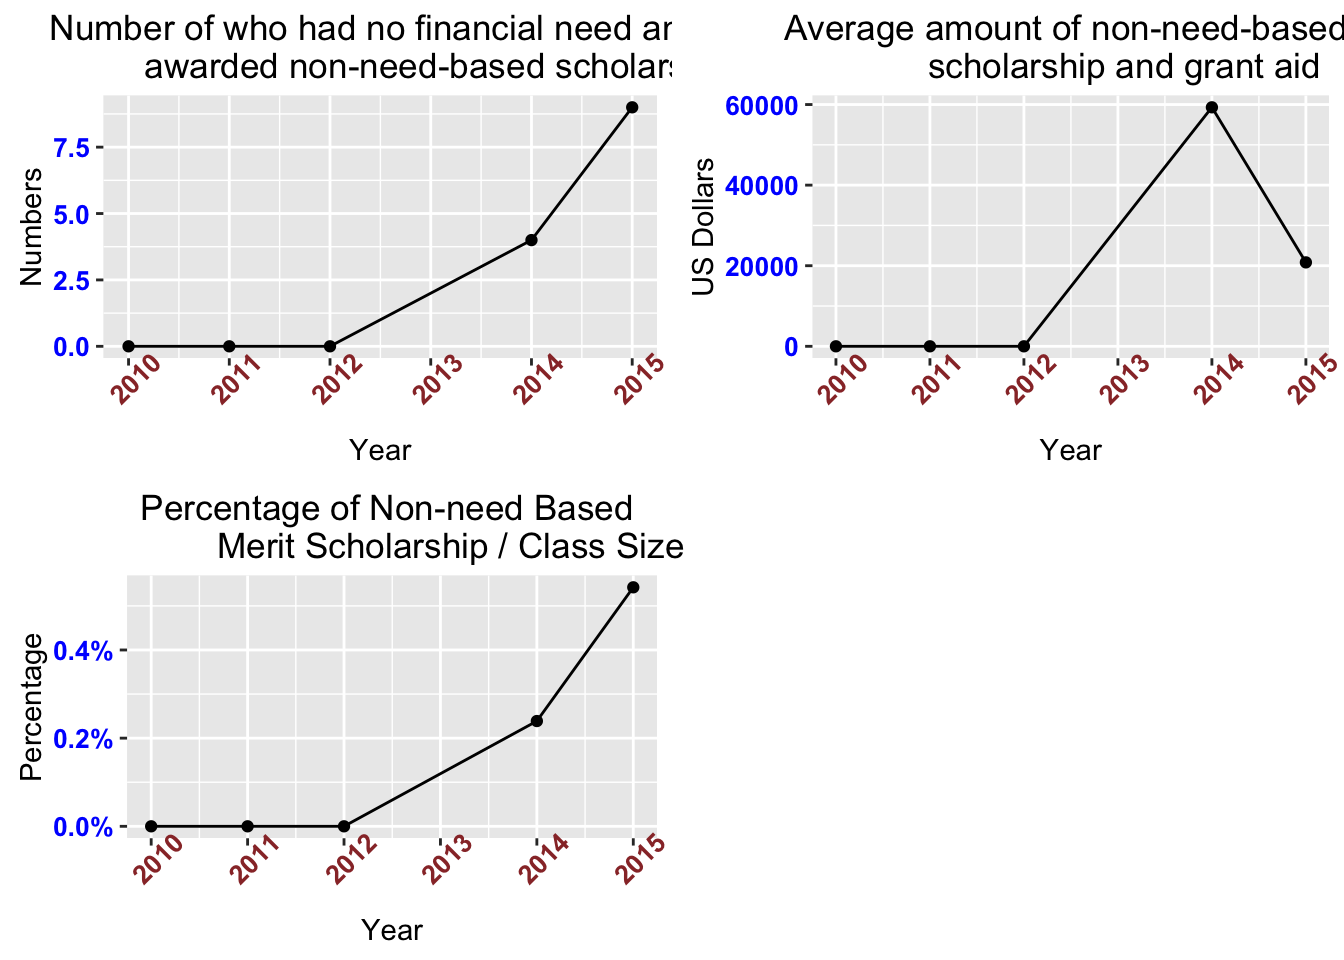
Merit scholarship at Harvard is a different story, but not one that is unanimous across all universities. Only a handful of students, usually less than 10, are awarded this aid each year. It has been increasing each year but the percentage number is well below 1% of the class.
Conclusion
In this article we focused on class size, degree trends, and financial aid. We chose Harvard as one university to demonstrate the trends across these three key areas for college admissions. After reflecting on how insights into college admissions data can provide a fuller picture of college admissions, we see how data matters. For more information and advice on how to interpret it, book a free consultation today.
