Applications
What College Yield Rates Reveal About Demand and Selectivity

In thinking about college, parents naturally gravitate toward acceptance rates. It’s the number universities paste on their websites to seem selective. It’s fair enough in some cases. A 4% admit rate is a real wall.
But there’s another number that’s just as important, telling you something acceptance rate never will. Yield. Admit rates answer the question: “How hard is it to get into this school?” Yield asks a different one: once students get in, do they actually go?
Yield is a demand signal that says a lot about a school’s status and desirability. It’s also harder to read at a glance.
First off, what’s yield?
Yield is the share of admitted students who enroll. A school accepts 2,000 students, and 1,600 show up on campus in September. That’s an 80% yield — which, as it turns out, is really high.
Here’s why yield matters. Acceptance rate is an easy number to nudge in admissions. A flood of applicants swells the denominator, whether or not they’re serious applicants. The admit rate falls. Nothing about the school’s real acceptance odds has changed: it just looks more selective on paper.
Yield is harder to game, though it isn’t entirely immune. The main lever in increasing yield is Early Decision. A binding round locks students in before they can weigh competing offers, sometimes at the applicant's expense.
So yield can be nudged. Strip away the effects of ED, though, and what’s left is honest: a number that climbs only when admitted students pick a school over every other acceptance in their inbox.
Predictably, the famous names have the highest yield. The University of Chicago yields around 88%, though it does use Early Decision to inflate this number. MIT, at 86%, and Harvard, at 83%, don’t. In fact, we refer to Harvard, Yale, MIT, Stanford, and Princeton as the earned elite. Instead of binding ED, they offer non-binding Early Action. They don’t need a commitment because most admitted students already say yes.
These are the universities everyone knows, and U.S. News confirms are at the top of the rankings. No surprise here. Save your attention for what happens further down the list: that’s where yield starts teaching us something.
The UC system: yield isn’t a scoreboard, but an important directional signal
The UC system is a case study in applicant demand. They don’t have binding Early Decision, and every student goes through the same process. The portal opens, and students submit their materials and PIQs to several universities in one go. A strong student might receive 7 or 8 acceptances. Only one of those offers becomes an enrollment.
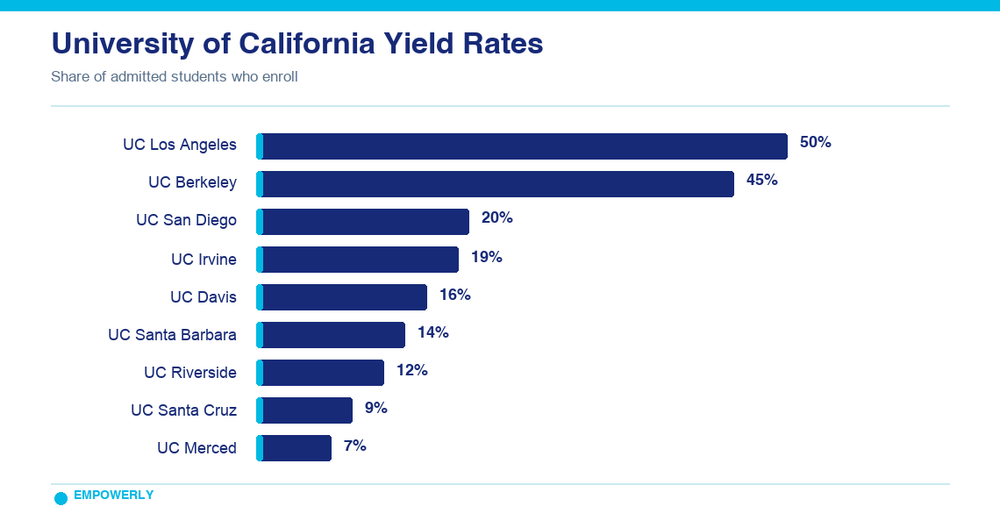
UCLA lands near 50% and Berkeley around 45% yield rate. These top-tier flagships usually aren’t fighting cross-admit battles with other schools in the UC system. Instead, they’re likely competing for students at other highly selective institutions. Still, it’s one thing to know that UCLA admits 9.4% of students. It’s another to recognize that it only enrolls 50%. This is far from a knock against UCLA, however, as we’ll see below.
The other campuses sit lower: from UC San Diego at a 20% yield to UC Merced at 7%. While this means they’re less desirable (which you probably already knew), they’re competing against schools like UC Berkeley. Every campus feeds into the same statewide pool, and each admitted student can only say once.
So read the chart with caution. UC San Diego ranks 29th among national universities, and Davis and Irvine run close behind. If anything, these rankings show that the UC System is the envy of the country, and students in the Golden State should count their blessings.
Admit rates also vary widely by major. Humanities students enjoy a 25% acceptance rate, while CS and Business majors clock in at 6% and 5%, respectively. In other words, a CS major applying to UC San Diego likely faces tougher odds than an English major at Berkely.
That’s the lesson from looking at yield across the UC system. Treat yield as a broad measure of demand within a specific context (UC exceptionalism) and with caveats (majors and program-level admit rates), and it's a useful measure of applicant demand.
Context is king for yield at public flagships
It’s tempting to look at the numbers at UC Berkeley or UCLA and compare them to the handful of Ivies with yield rates above 80%. That would be a mistake.
Start with the real benchmark, because it changes how you read everything below. First, here are the public flagships with the highest yield.
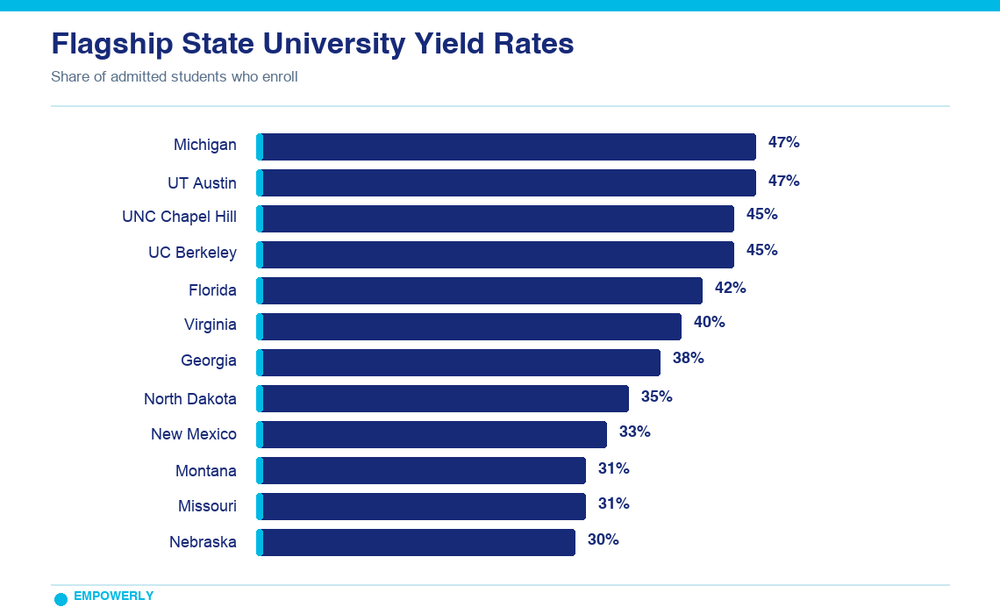
Across the fifty-odd state flagships, the median yield is 23%. The typical public flagship, in other words, watches more than three-quarters of its admitted students walk away. That’s normal. Ohio State, Maryland, and Wisconsin all sit in the low to mid-twenties. UMass Amherst, Alabama, and Indiana are near 18%. These large, highly regarded universities admit less than 75%. In this context, a low yield is the baseline, not a red flag.
This also makes the schools at the top of this chart all the more impressive. Michigan and UT Austin enroll 47% of admitted students, while North Carolina enrolls 45%, Florida 42%, and Virginia 40%. Holding a flagship’s yield above 40% is a rare feat, taking some mix of in-state pride and real national pull to achieve.
This lets us reevaluate the bottom of the chart with fresh eyes. North Dakota enrolls 35% of admitted students and Montana 31%. Set against a 23% median, these universities aren’t an afterthought. They comfortably clear the bar for student demand. The reason may be in-state preference for some of these institutions, with a pool self-selecting before a single acceptance email is sent.
Keep that idea in the back of your mind, because it explains our more surprising findings below.
Self-selection and affiliation muddy the waters
At small liberal arts colleges, things get really interesting.
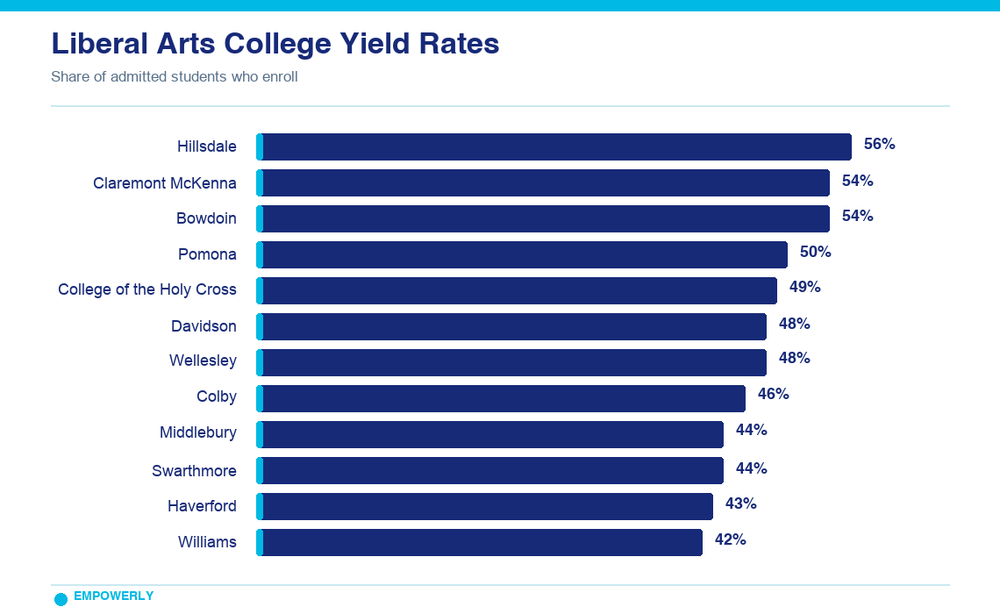
Claremont McKenna makes sense: it’s one of the most elite liberal arts colleges in the country. As do some of the other colleges on this list: Bowdoin, Davidson, Wellesley. They compete with major universities such as UC Berkeley and the University of Michigan.
But what’s going on with Hillsdale College? It has an elite yield that puts it above UCLA and other universities in the Top 25, including Johns Hopkins, Rice, and Emory. Hillsdale admits 21% of applicants. How does a more accessible school out-yield such heavyweights?
The answer is affiliation. As a Christian college, Hillsdale attracts students for this reason. Nobody applies to Hillsdale by accident, and its applicant pool has already made up its mind. BYU pulls the same trick at scale: as a college associated with the Church of Latter-Day Saints, it has a 78% yield rate that rivals the top Ivies. But again, the self-selecting caveat holds: BYU admits 68% of applicants, most of whom say yes because of the school’s religious affiliation.
How to actually use this in building a college list
Yield maps demand. It doesn’t tell you anything about quality and fit.
Here are a few considerations:
A high yield paired with a high admit rate can be a false positive. When a school accepts a healthy share of applicants, and most of them enroll, students might have another reason to attend beyond academic quality. We saw this with Hillsdale College and BYU.
A low yield at a great school is not a warning. Rice, Emory, Carnegie Mellon, and Johns Hopkins all yield in the low-to-mid 40s, and they’re superb. Their yield is lower only because they’re competing for the same pool of students as larger brands like Princeton and Harvard.
A yield gap makes Early Decision a strategic lever. Schools use Early Decision (ED) to manufacture a lower acceptance rate. When a school you love sits below the yield leaders, its binding ED meaningfully affects your odds. Match your first choice to the round that rewards commitment, and you’ve turned this number to your advantage.
The numbers that actually matter
Judging a school by its yield rather than its acceptance rate is the kind of data-driven shift that separates an application strategy from wishful thinking. Doing it well on your own is nearly impossible. Thousands of schools, with dozens of metrics to weigh (yield, admissions factors, acceptance rates by major), make it a Herculean task.
That’s the work Empowerly counselors do every day. We help students build a balanced list by interpreting the real figures behind the numbers. Our recommendations are grounded in the data and shaped by counselors who know what makes admissions officers tick.
If you’re putting together your college list, let’s make sure it’s built on the numbers that matter.
A note on the data: figures reflect Peterson’s 2025 Undergraduate Institutional Data. Yield is calculated as enrolled first-year students divided by admitted students. Acceptance rate divides admits by applications. College rankings are derived from U.S. News 2026 Best Colleges edition.