Applications
Empowerly Acceptance Rates: Class of 2026 Admissions Results


Every year, the same story repeats itself: the applicant pool grows while the number of seats does not, and admission to a selective US college is just as hard, if not harder, to secure than it was twelve months ago.
Geography, feeder-school ties, institutional priorities: these factors shape outcomes in ways no applicant controls, and a strong transcript or a full extracurricular resume guarantees nothing on its own. That said, we see in every cycle that applicants with both rigorous academics and extracurriculars can meaningfully improve their odds.
Through the sustained work our students do and the careful planning and strategic guidance we provide, they increase their chances of earning admission to their favorite college. The deliberate shaping of a student's story around what genuinely interests them, the early conversations about fit, and the essay drafts that go through a dozen revisions: this is what the long runway looks like before an application is submitted.
And the outcome? That's what this post puts into numbers. Below are Empowerly's acceptance rates for the Class of 2026: where our students landed among the country's most selective schools, what academic and extracurricular profile tends to open those doors, and what the financial picture looked like once the acceptances came in.
Empowerly acceptances vs. the national average
The widest gap of all between our students and the national average shows up in the Ivy League. Across all eight schools, 17% of our students were accepted, compared to a 5.4% national average, putting their odds at 3.2x the overall rate, with the widest gaps at Dartmouth (4.4x) and at both UPenn and Columbia (3.8x each).
The Ivy League cohort
| College | Overall Admit Rate | Empowerly Acceptance Rate | Empowerly Multiplier |
|---|---|---|---|
| Cornell University | 8.4% | 26.6% | 3.2x |
| University of Pennsylvania | 5.4% | 20.4% | 3.8x |
| Brown University | 5.3% | 13.9% | 2.6x |
| Harvard University | 3.6% | 11.8% | 3.2x |
| Columbia University | 4.2% | 11.9% | 2.8x |
| Yale University | 4.2% | 11.9% | 2.8x |
| Princeton University | 4.6% | 5.9% | 1.3x |
| Dartmouth College | 5.4% | 23.6% | 4.4x |
Ivy League results show that the Empowerly approach matters most where the odds are worst. But a multiplier alone doesn't explain why it works. So what does that student actually look like?
We tracked the outcomes of 544 students who applied to the Ivies this year, and the data shows a high-achieving cohort: an average 3.93 GPA and a 1520 test score.
But there is more to the picture than just academics: plenty of applicants with top scores were also turned away. When academic perfection is the baseline rather than the differentiator, which is what happens at this level of selectivity, the decision comes down to everything else. The essay. The choice of early decision vs. regular decision. The depth and impact of the extracurricular list, not its length.
Take two applicants to UPenn this cycle, nearly identical in GPA and test scores. One worked with us for 6 months and applied regular decision with a 3.96 GPA and a 1520; the other joined us as a 10th grader and applied early decision with almost identical scores. The first was rejected; the second was accepted.
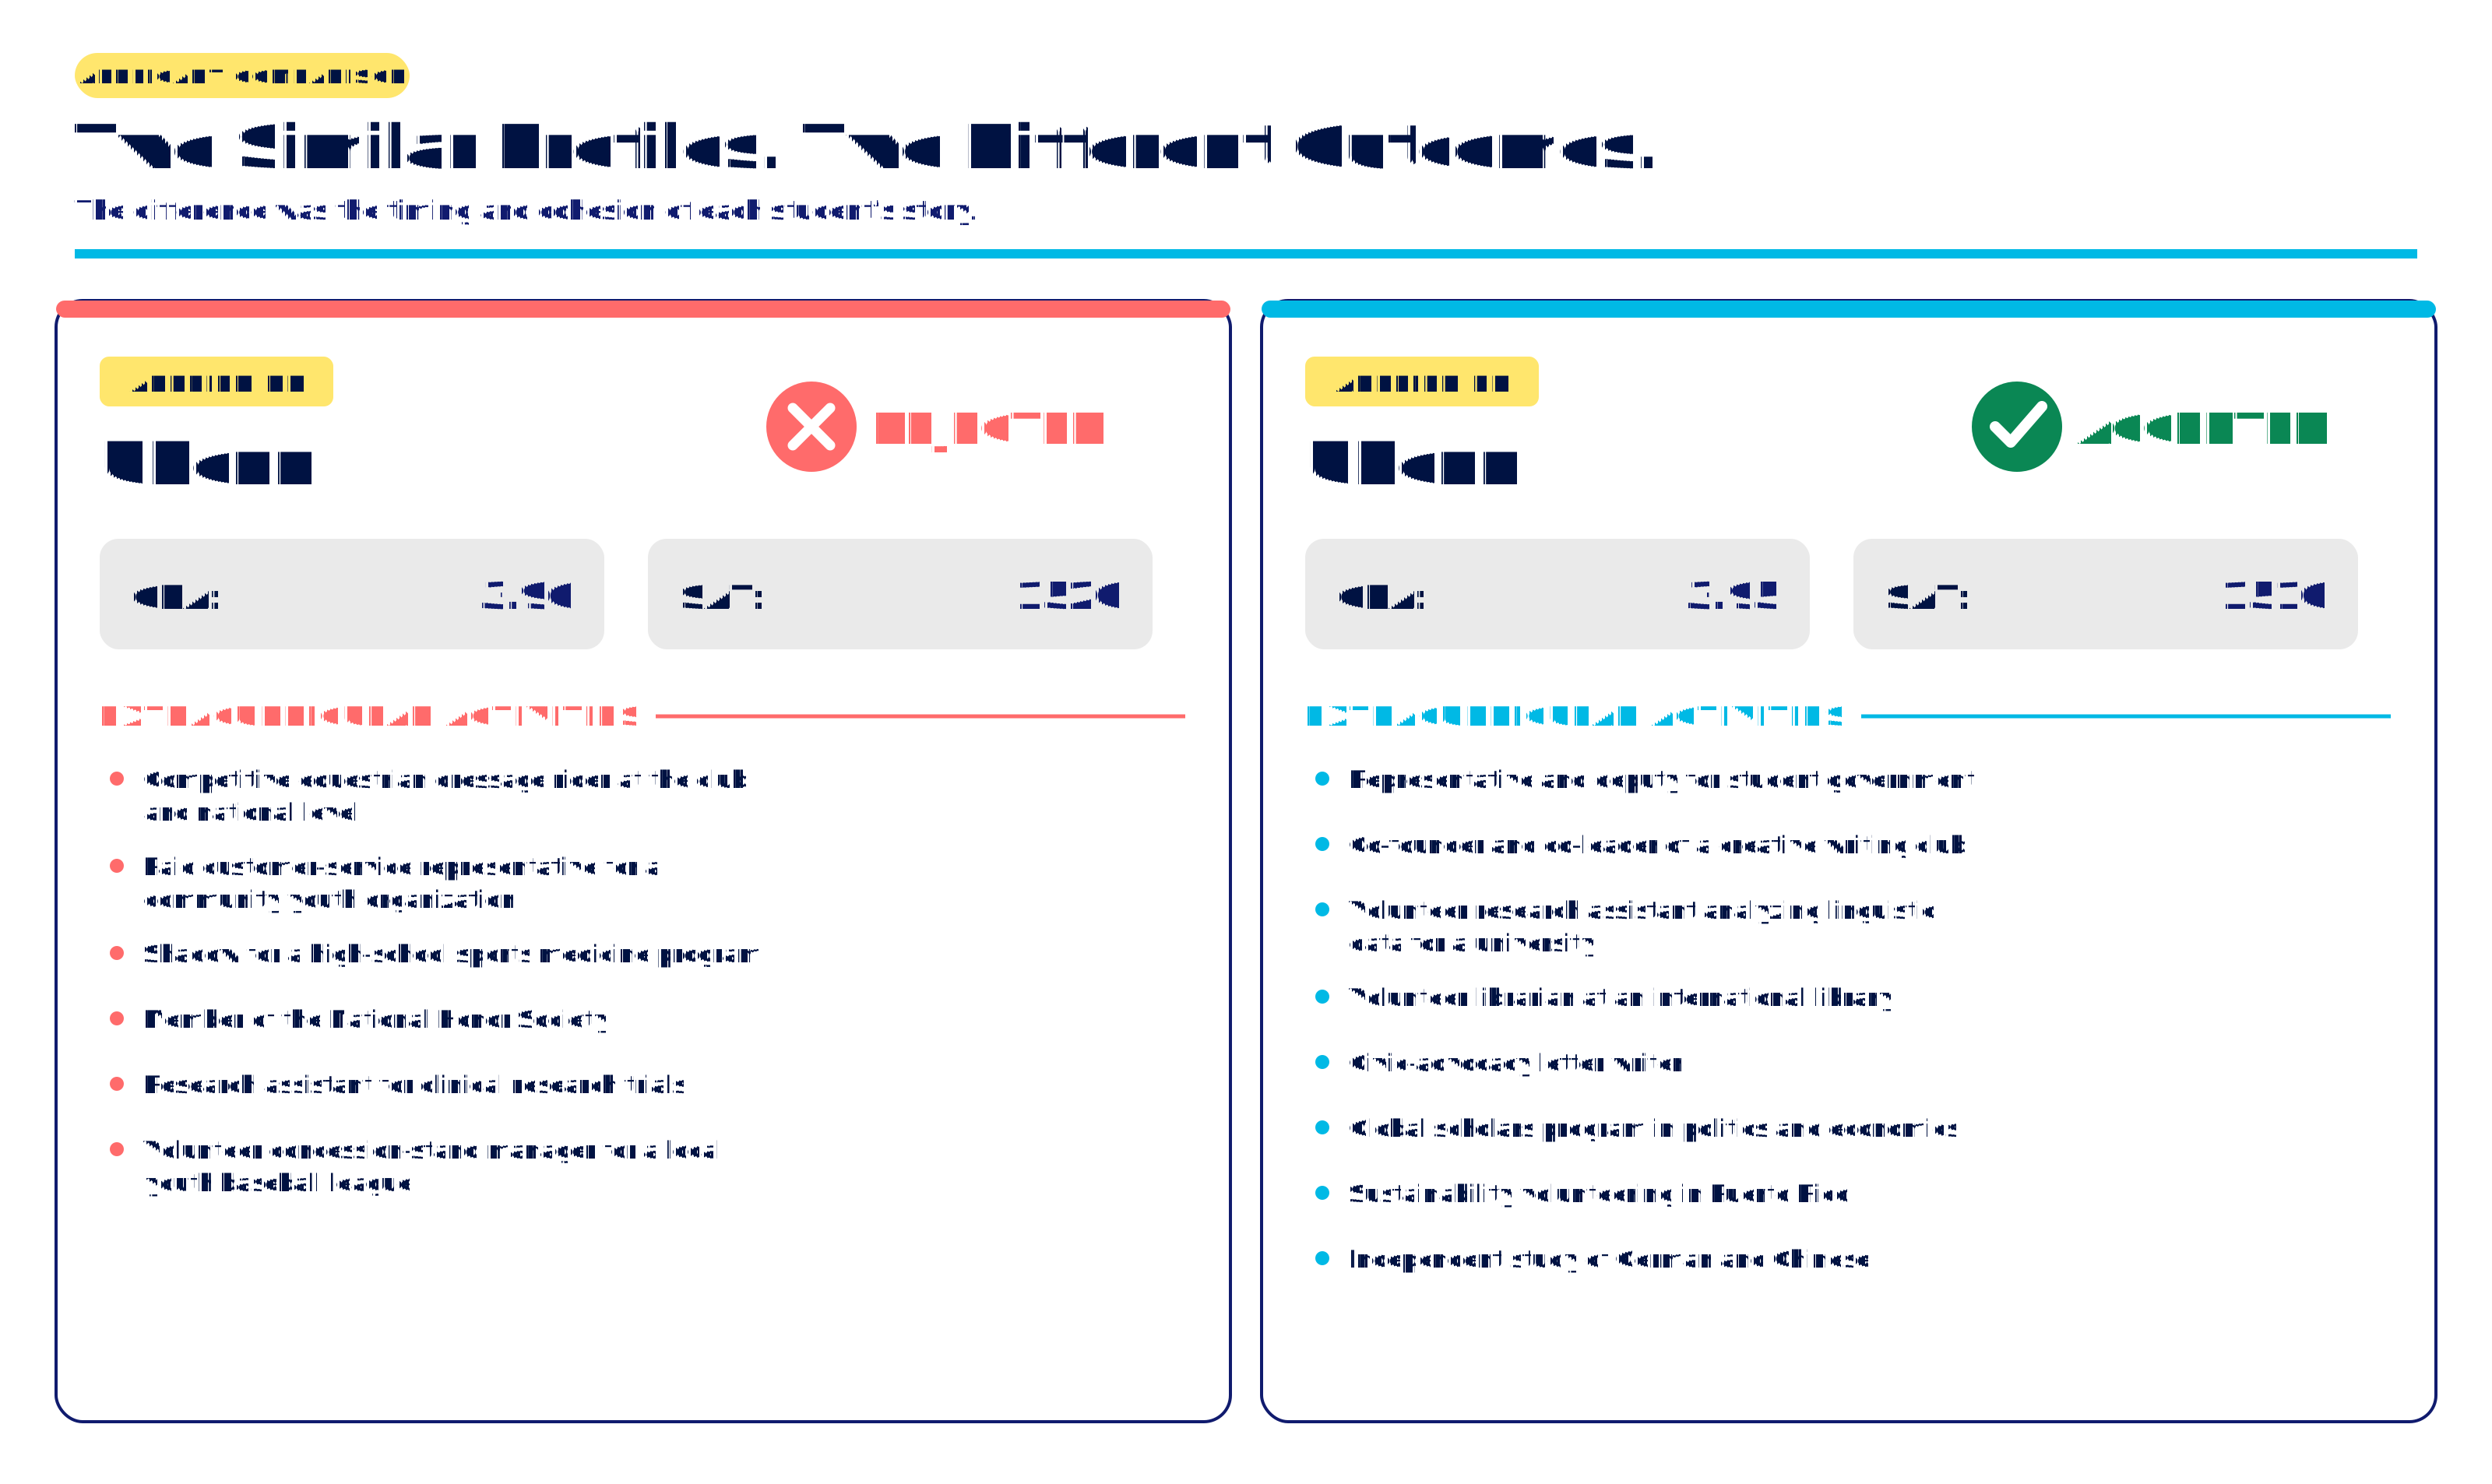
The rejected applicant's activities were impressive on their own but disconnected from one another: competitive dressage, a sports-medicine shadowing program, clinical trials research, a customer-service job, concession-stand volunteering. Each one real, but very few speaking to the others.
The accepted applicant's list reads more cohesively, building on itself. In the civics bucket: leadership in student government, civic advocacy letter-writing, sustainability volunteering in Puerto Rico, and a global scholars program in politics and economics. In the linguistic bucket: co-founding a creative writing club, volunteer linguistics research, self-directed study of German and Chinese, and work at an international library.
That's the difference a compelling extracurricular profile and an early start make. Students who work with us over a longer stretch of time have room to build something that holds together. Rather than showing a scattered list of activities, they have projects that connect and deepen over time, telling a clear story about who they are.
Empowerly acceptance rates at the Top 25 colleges
At the top 25 most selective colleges in the US, the national admit rate has stayed close to where it has for years, under 10% for nearly every school on the list. But our students hit a much higher admit rate. Across every application our students submitted to those same 25 schools, 24.4% were admitted, compared to a national average of 8%.
| College | Overall Admit Rate | Empowerly Acceptance Rate | Empowerly Multiplier |
|---|---|---|---|
| Stanford University | 3.6% | 13.0% | 3.6x |
| Carnegie Mellon University | 11.7% | 28.6% | 2.5x |
| Emory University | 12.3% | 38.7% | 3.1x |
| Northwestern University | 7.2% | 19.4% | 2.7x |
| University of Chicago | 4.5% | 35.1% | 7.8x |
| Johns Hopkins University | 6.4% | 20.0% | 3.1x |
| Rice University | 7.7% | 30.2% | 3.9x |
| Vanderbilt University | 4.7% | 15.1% | 3.2x |
| Georgetown University | 12.9% | 38.3% | 3.0x |
| California Institute of Technology | 2.6% | 33.3% | 13.0x |
| University of Notre Dame | 9.0% | 35.0% | 3.9x |
Empowerly’s University of California acceptance rates
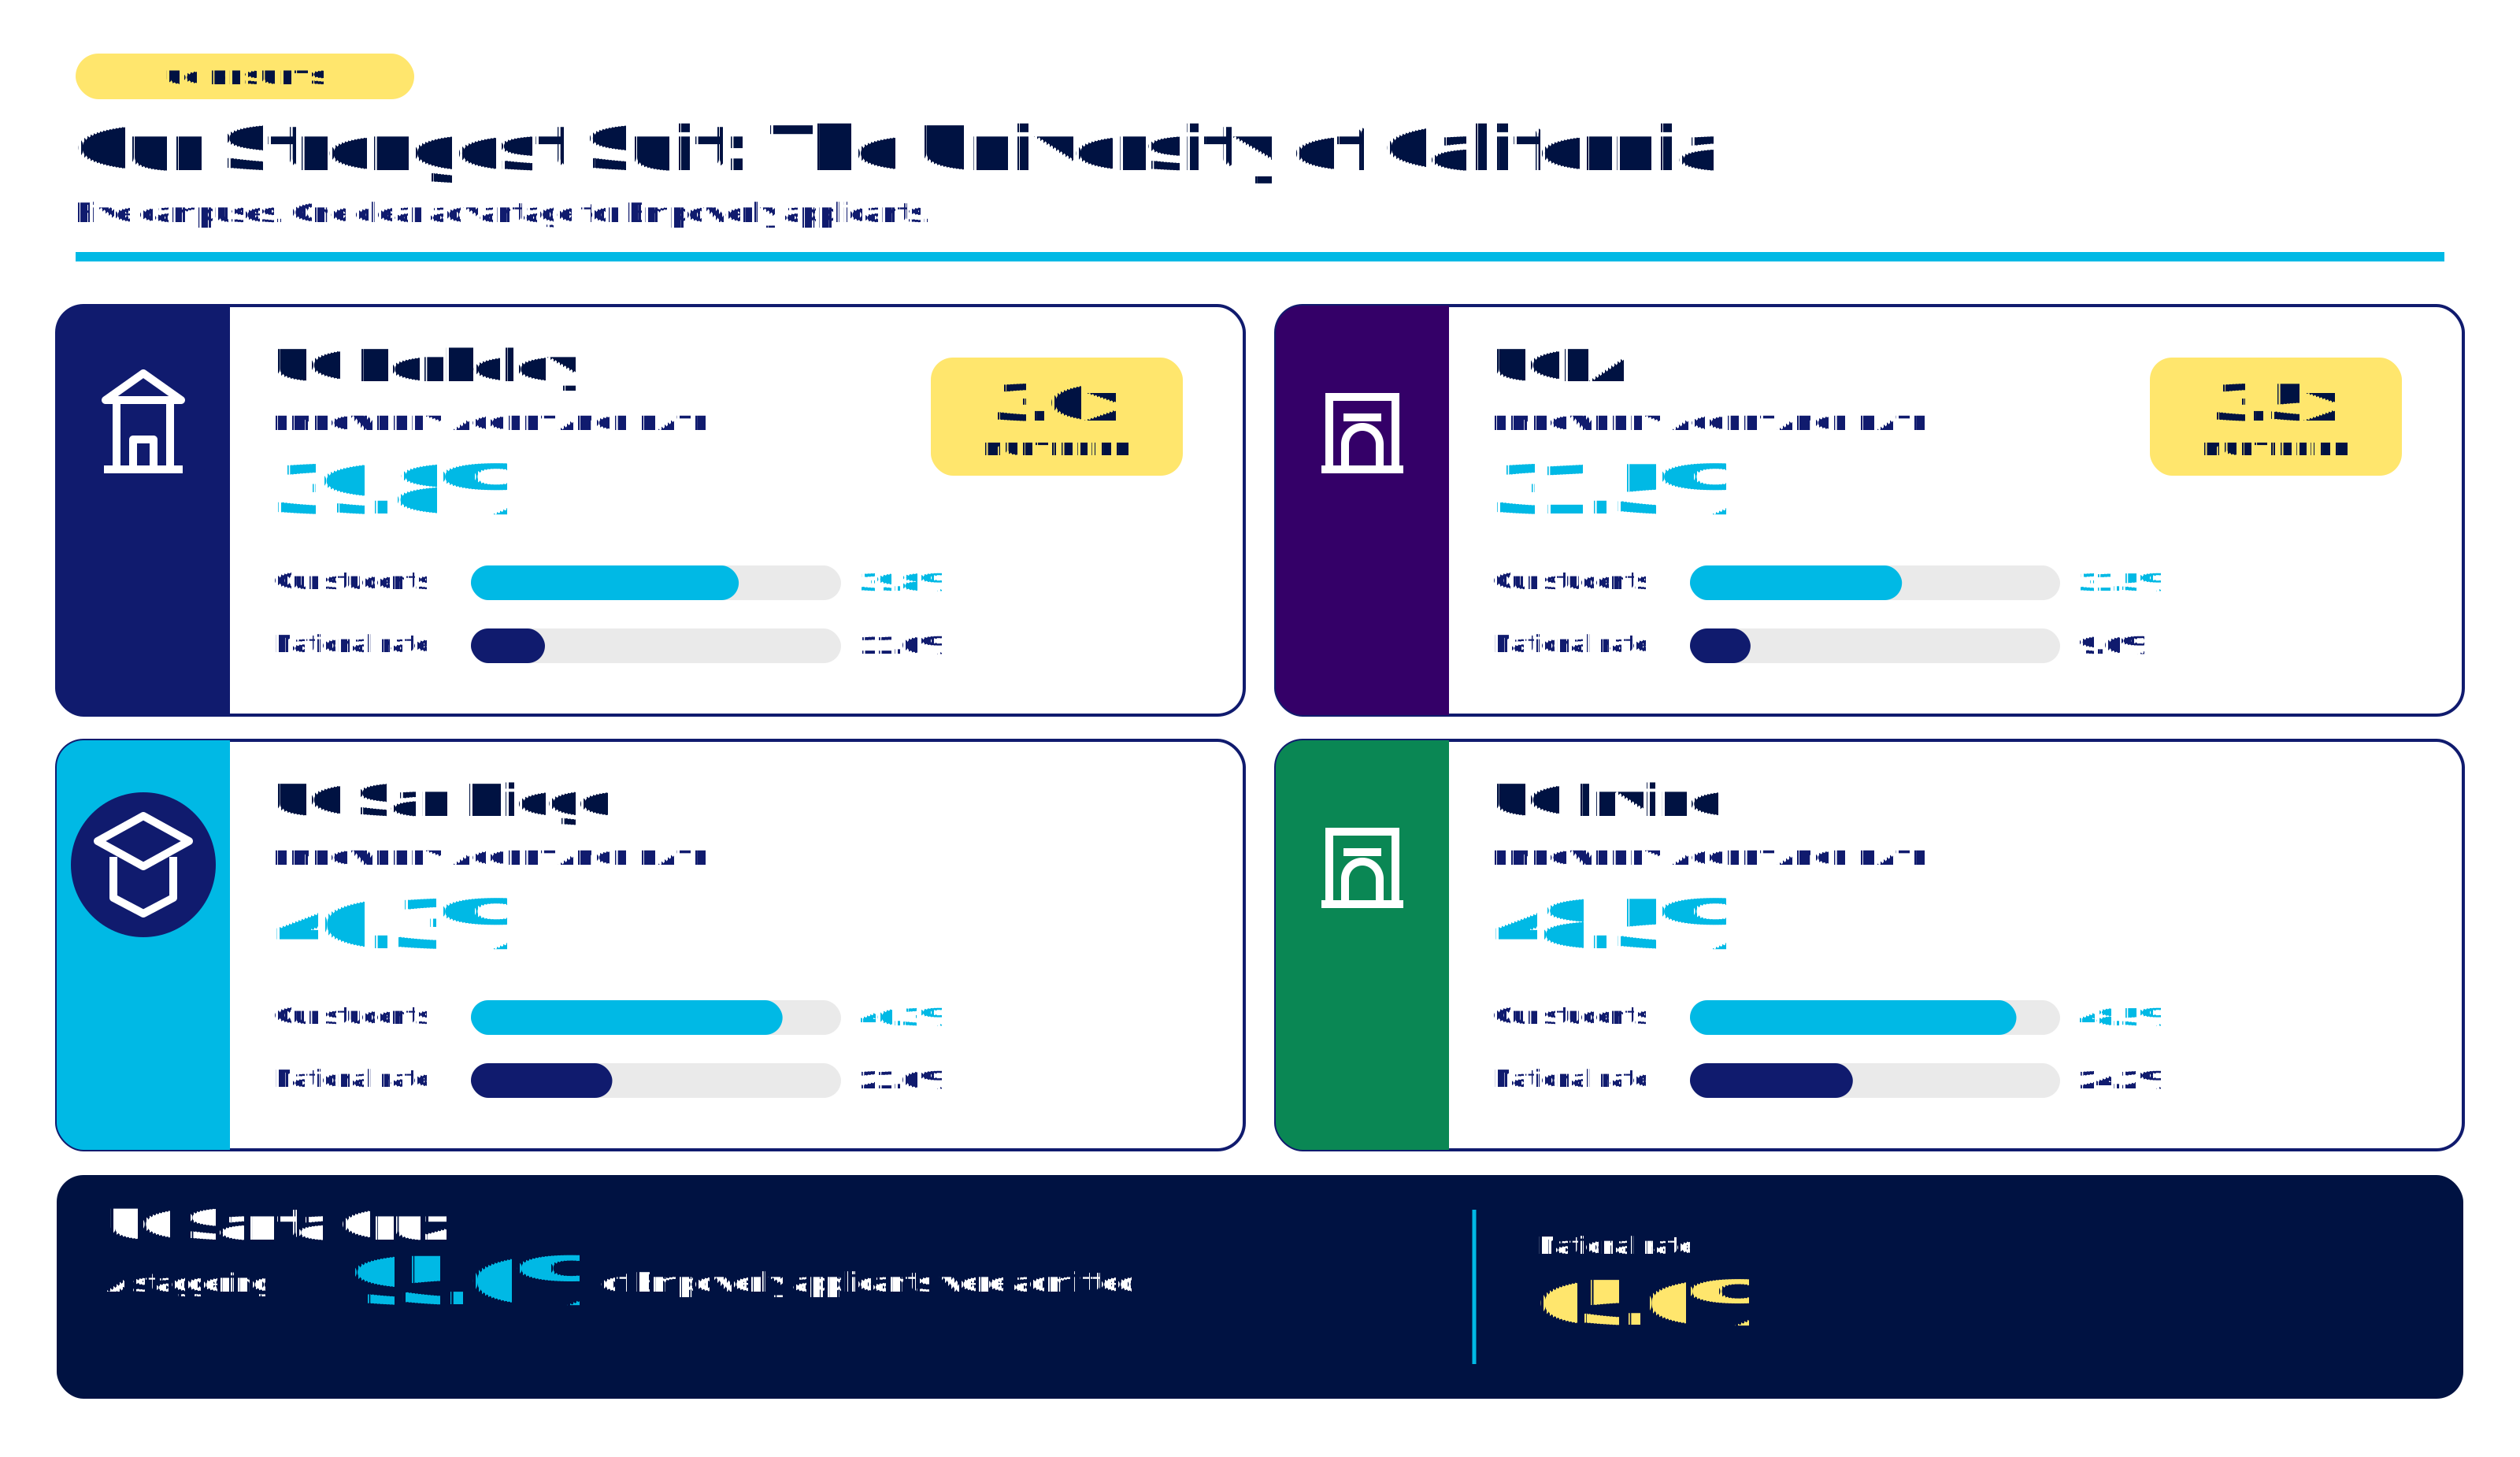
The University of California system remains one of the most impacted public university networks in the world, with nine undergraduate campuses, each with its own admit rate, its own read of "fit," and many with an increasingly narrow margin for error. It's also where the largest share of our students apply, making it the system we know best.
Here, our counselors made the difference; several are former UC application readers and admissions officers themselves, bringing insight into how UC applications are read. With that guidance, our students navigated these campuses with a substantial advantage.
Empowerly Early Decision acceptance rates
In college admissions, it's not just what you've achieved that is important, but also when you apply. It's no secret that applying and committing early tends to open more doors than in the regular round.
Colleges use early decision to manage yield by filling a share of the incoming class with committed students, which means the applicant pool a school chooses from in that round is smaller and every seat carries less risk of rejection.
For Empowerly students, applying early decision doubled our students’ admit rate to 81% compared to our overall admission rate of 41% at these same colleges.
| College | National ED Admit Rate | Empowerly ED Acceptance Rate | National Overall Admit Rate | Empowerly Overall Acceptance Rate |
|---|---|---|---|---|
| Brown University | 14.44% | 100% | 5.3% | 13.9% |
| Carnegie Mellon University | 14.2% | 80% | 11.7% | 28.6% |
| Columbia University | 13.2% | 66.7% | 4.2% | 16% |
| Cornell University | 11.6% | 83.3% | 8.4% | 26.6% |
| Dartmouth College | 19.2% | 66.7% | 5.4% | 23.5% |
| Duke University | 17.3% | 66.7% | 4.7% | 22.1% |
| Harvard University | 8.7% | 33.3% | 3.6% | 11.8% |
| Johns Hopkins University | 11.7% | 100% | 6.4% | 20% |
| Northwestern University | 22.6% | 62.5% | 7.2% | 19.4% |
| Rice University | 16.8% | 33.3% | 7.7% | 30.2% |
| University of Pennsylvania | 14.2% | 50% | 5.4% | 20.4% |
| Vanderbilt University | 13.2% | 60% | 5.4% | 15.1% |
The financial payoff
Admission is one half of the equation; affordability is the other, and this year's merit scholarships held their own. Standout offers included: Vanderbilt’s full-tuition Chancellor's Scholarship ($68,000/year), Barbara Jordan Scholarship at Rice ($60,000/year and only awarded to 15 students), UVA Jefferson Scholarship ($50,000/year), and Johns Hopkins’ Hodson Trust Scholarship ($42,500/year awarded to only 20 students).
Add the merit aid, and our students brought in $12,467,292 per year. That averages to $57,700 per student per year, with 30 students securing a full ride or scholarships valued at $50,000 or more.
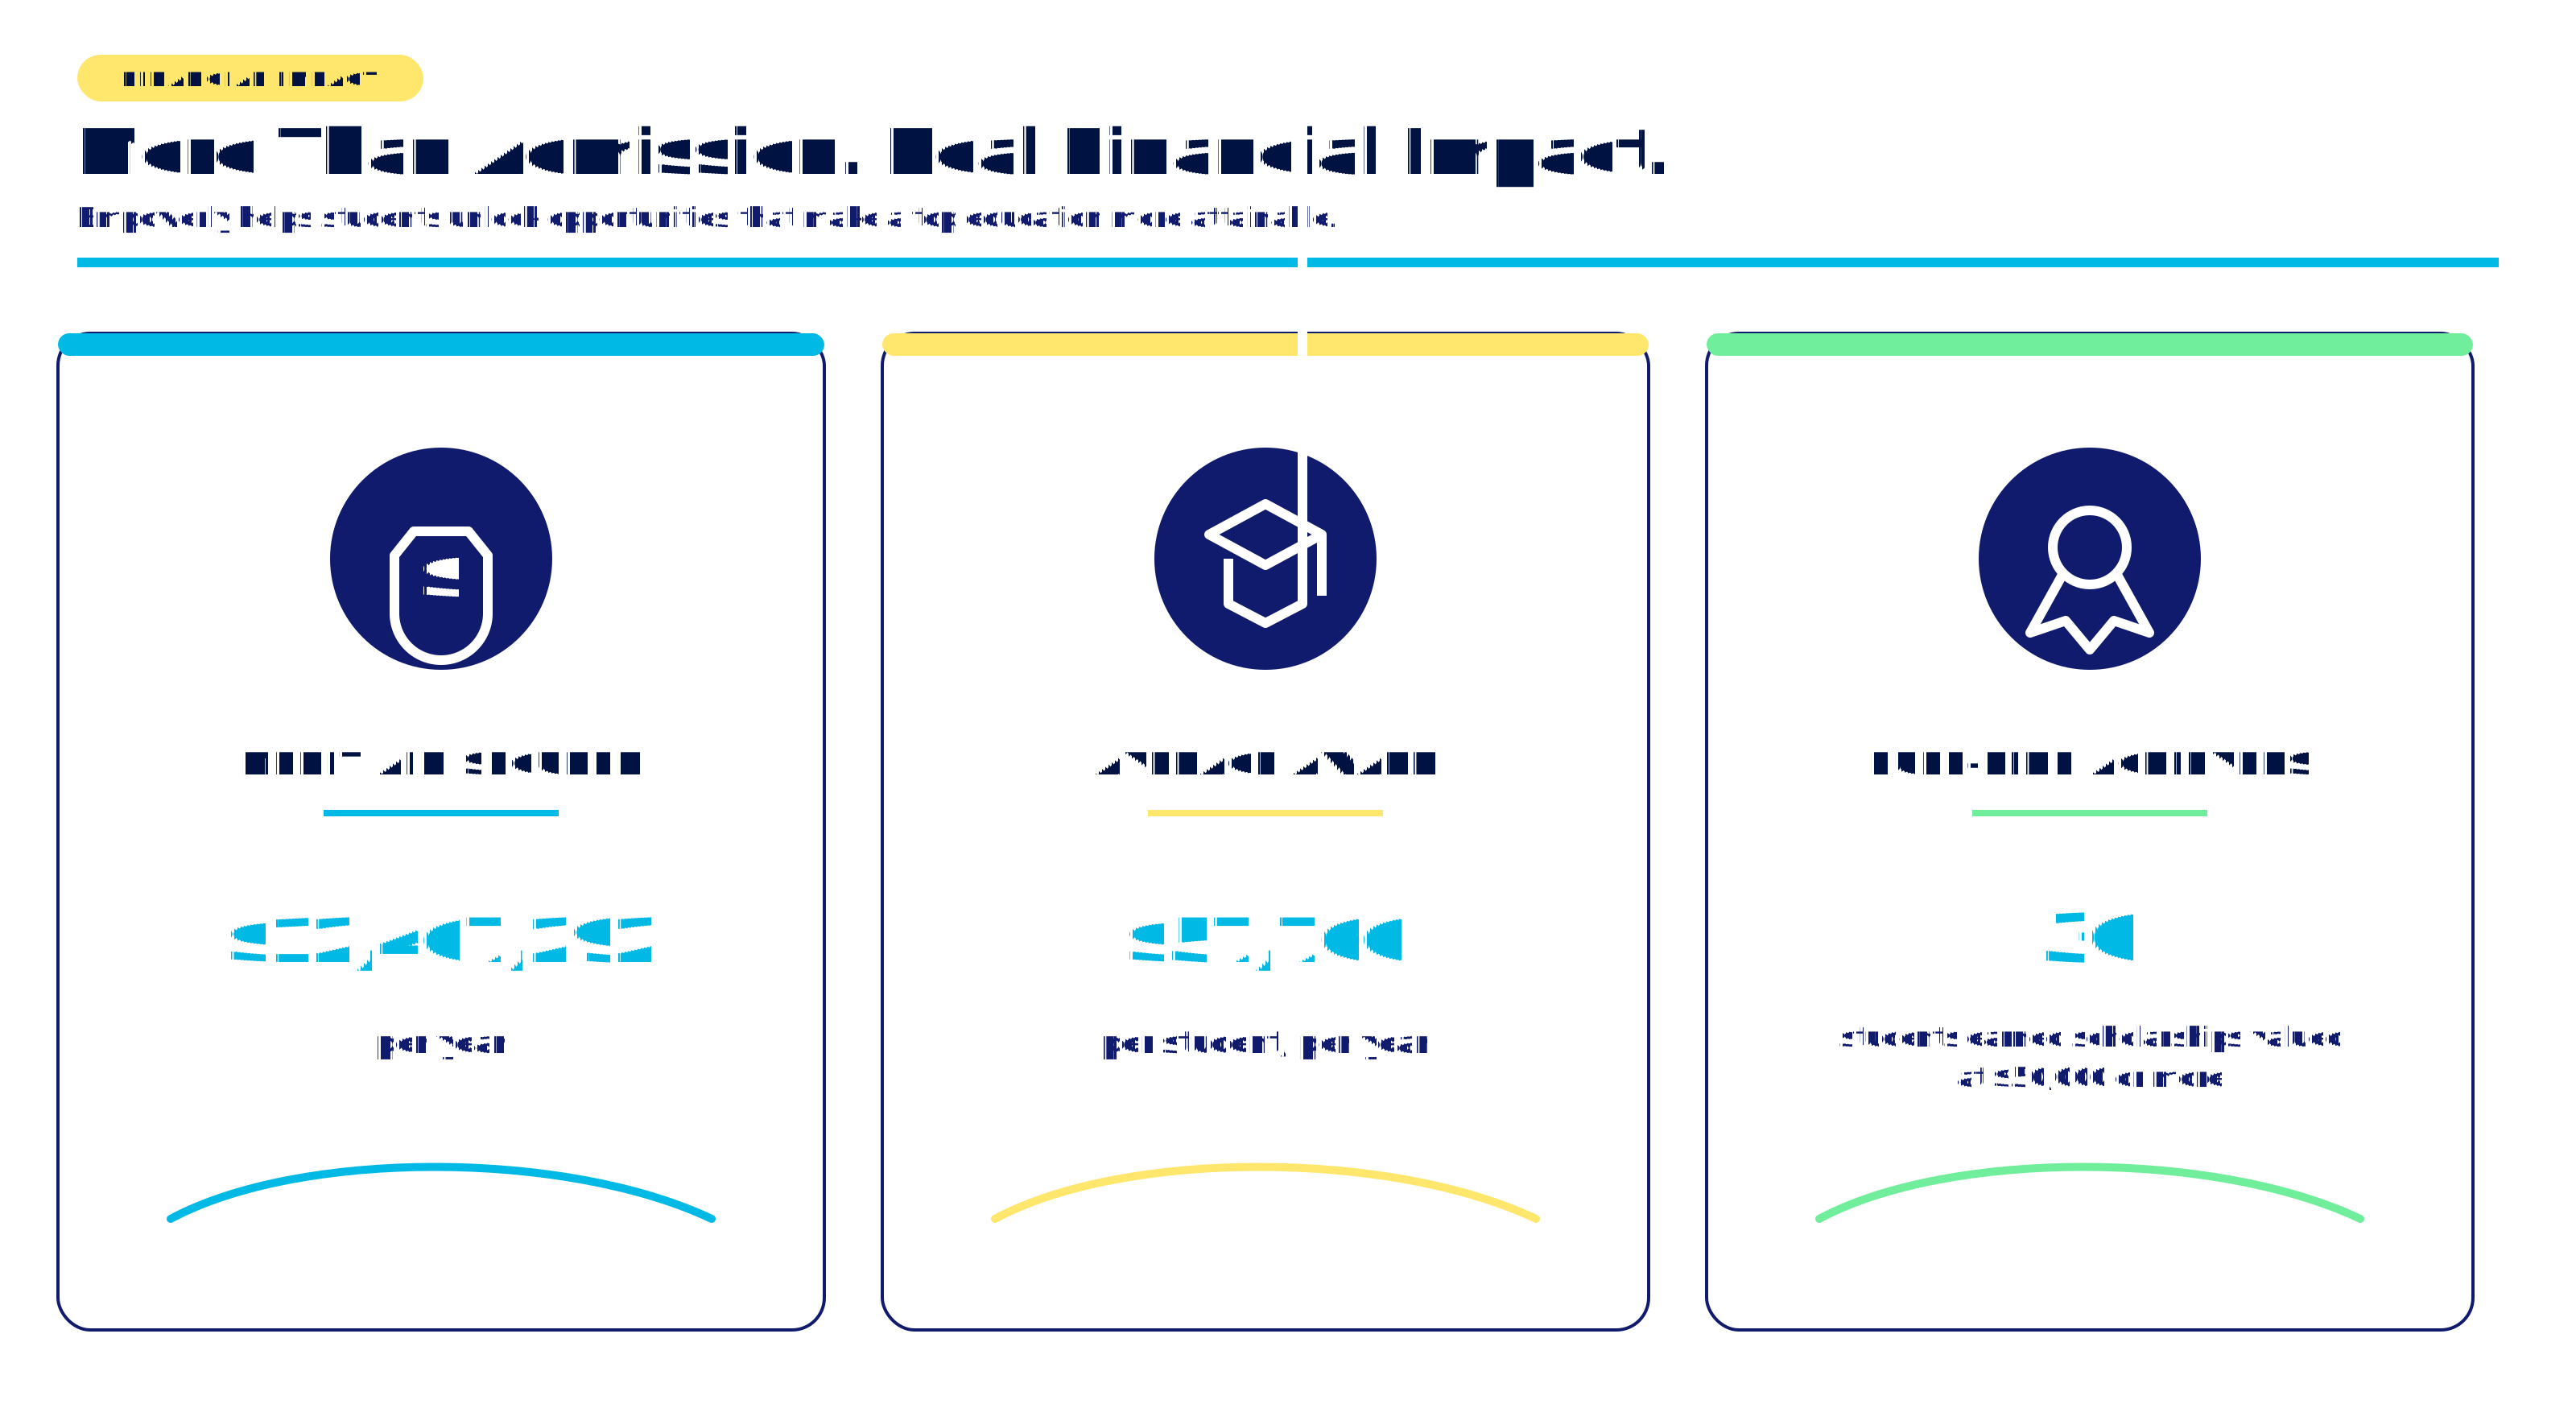
This is the work of our team of counselors, who treat scholarship applications with the same rigor as admissions essays, coaching students through separate personal statements, interview prep, and portfolio requirements that many of these awards demand on top of the standard application.
Empowerly acceptance rates to BS/MD programs
Accelerated medical programs are, by most measures, the least forgiving in college admissions. National acceptance rates typically sit between 1% and 5%, and a guaranteed path into medical school straight out of high school is rare enough that most counselors will only encourage their strongest students with the grades and a rigorous STEM profile to apply.
That's exactly why our BS/MD counseling is its own track: students are matched with a counselor who specializes in these programs, who works with them to build their academic and clinical profile through research, shadowing, or clinical volunteering, and identifies colleges that best fit their goals.
This year, 70% of our students who applied were admitted, and several received more than one offer.
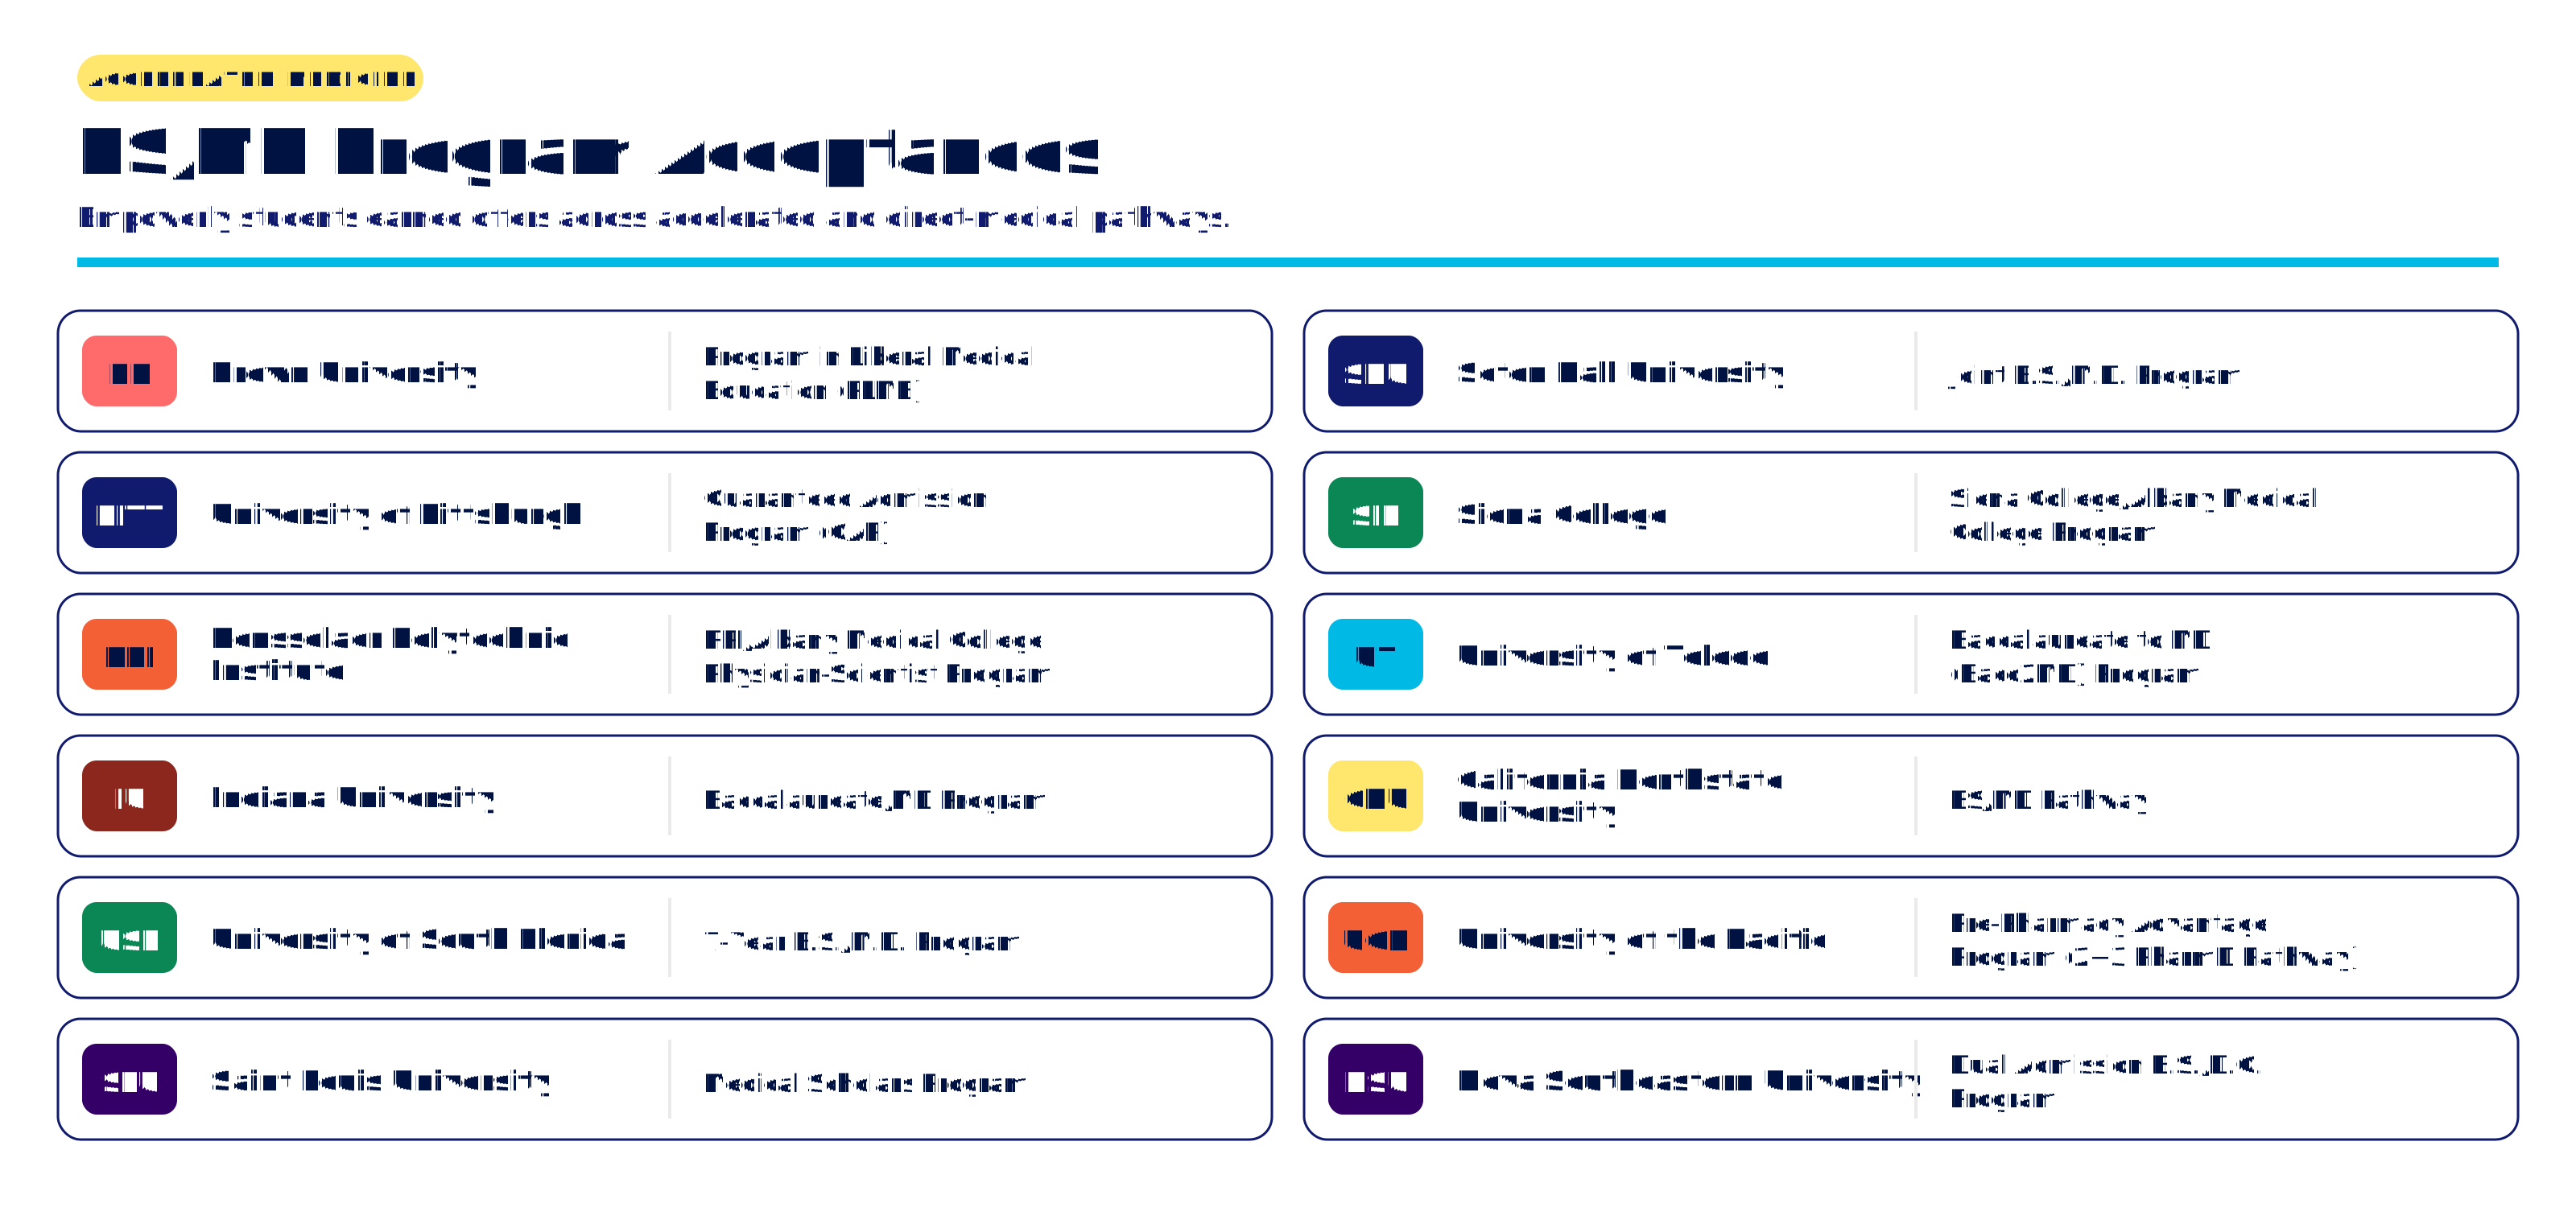
These numbers aren’t luck. They're the result of hard work by students, guided by counselors who know these schools from the inside and build a strategy around their students' actual fit, not a generic playbook.
If you're navigating college admissions, Empowerly can help you build an application strategy backed by the same insight that got our students these results.